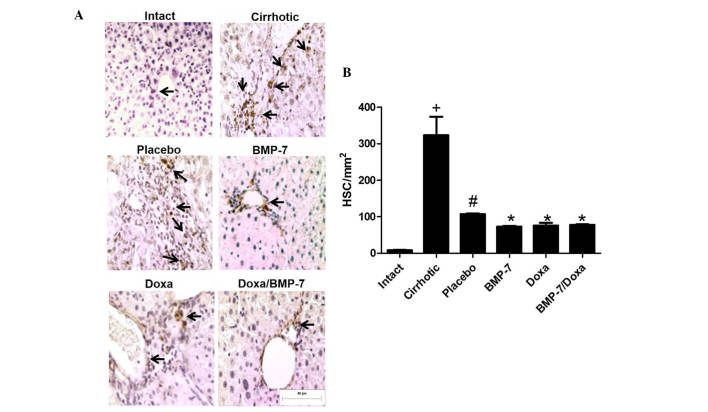
Figure 5.
Immunohistochemical quantification of α-SMA-positive cells in cirrhotic livers after adenoviral-BMP-7 transduction and doxazosin treatments. (A) Representative microphotographs observed at 20x, black arrows indicate HSCs. (B) Morphometric analysis of α-SMA-positive cells per unit of area. Data is presented as mean ± SEM. +P<0.001 vs. Intact; #P<0.005 vs. Cirrhotic; *P<0.005 vs. Placebo. HSC, hepatic stellate cells; BMP-7, bone morphogenetic protein; Doxa, Doxazosin; SEM, standard error of the mean.

