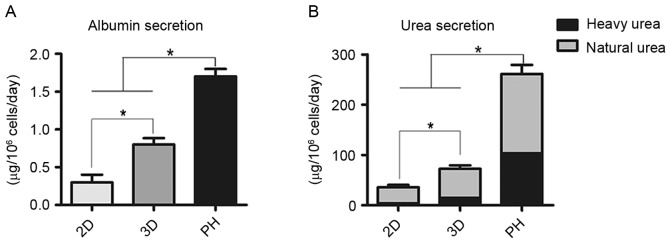
Figure 5.
Hepatic function analysis in mouse mesenchymal stem cells following 3 weeks of hepatic differentiation. (A) Albumin and (B) urea secretion following 3 weeks hepatic differentiation in the 2D and 3D groups and in the primary hepatocyte control group. Scale bars, 100 µm. *P<0.05. PH, primary hepatocytes.

