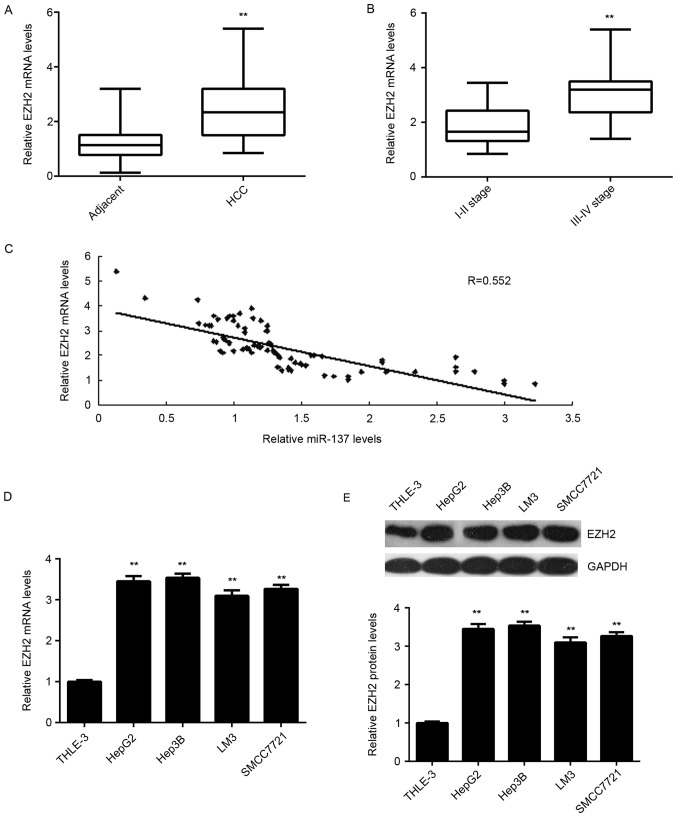
Figure 5.
EZH2 expression in HCC tissues and liver cancer cell lines. (A) RT-qPCR was used to examine the EZH2 mRNA expression in HCC tissues compared with adjacent non-tumor tissues. **P<0.01 vs. adjacent. (B) RT-qPCR was used to examine the EZH2 mRNA expression in stage III–IV HCC tissues compared with stage I–II HCC tissues. **P<0.01 vs. stage I–II. (C) An inverse correlation was observed between the miR-137 and EZH2 mRNA levels in HCC tissues. (D) RT-qPCR and (E) western blot analysis were used to examine the mRNA and protein expression of EZH2 in liver cancer cell lines and THLE-3 normal liver epithelial cells. **P<0.01 vs. THLE-3. RT-qPCR, reverse transcription-quantitative polymerase chain reaction; EZH2, enhancer of zeste 2 polycomb repressive complex 2 subunit; miR, microRNA; HCC, hepatocellular carcinoma.

