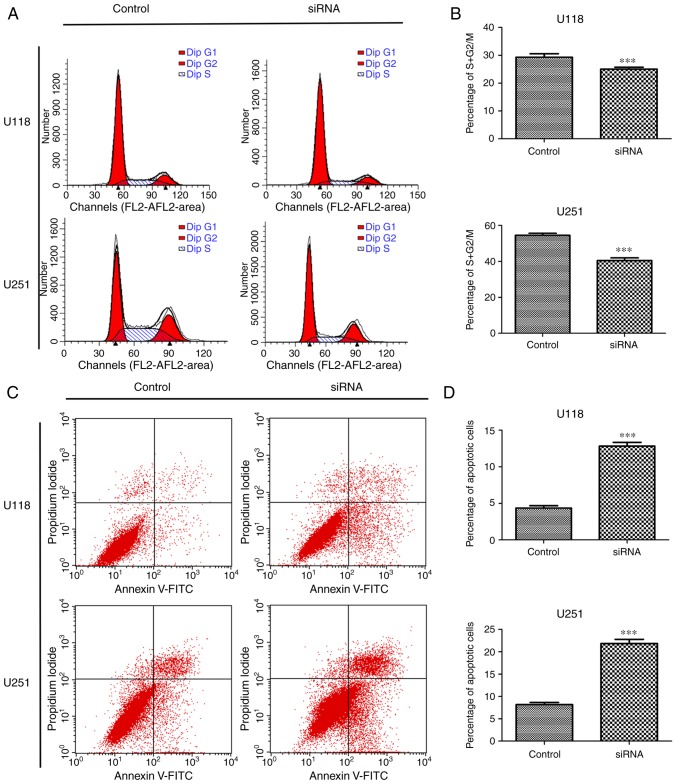
Figure 3.
Effect of structure-specific recognition protein 1 (SSRP1) on the cell cycle and apoptosis. (A and B) Silencing of SSRP1 arrested the cell cycle in both U118 and U251 cells as dtermined by flow cytometric analysis. A graphical representation of the mean ± standard deviation (SD) data revealed the percentage of cells in the S + G2/M phase. (C) The apoptosis rate of cells was assessed with Annexin V-FITC/propidium iodide by flow cytometry. (D) The quantitative analysis of apoptotic rates; ***P<0.001. Data are presented as the mean ± SD.

