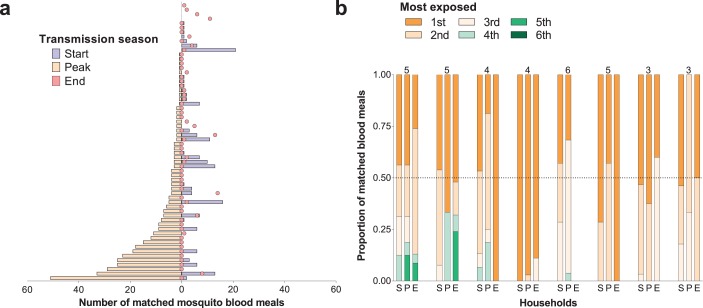
Figure 2. Temporal (a) and within-household (b) variation in exposure to malaria vectors.
In (a) individuals were ranked (y-axis) according to the number of matched mosquito blood meals at the peak of the transmission season. The left and right, symmetrical, x-axes represent the number of mosquito bites each individual received at the peak (orange bars), and at the start (blue bars) and end (red circles) of the transmission season respectively. Only individuals present during at least three collection days per survey in all surveys and matched to at least one blood meal (N = 62) are included in this panel. In (b) each of the three columns corresponds to a different survey (S, Start of transmission season; P, Peak of transmission season; E, End of transmission season) for a select number of households. Individuals in the same household are denoted by different colours, which are consistent in the different surveys. The proportions of matched blood meals linked to each individual by household and survey are on the y-axis; only the eight households with at least five matched mosquitoes at the start of the transmission season and three or more study participants are shown. The numbers of individuals living in the households are shown above the columns.


