. 2018 Jan 23;7:e31326. doi: 10.7554/eLife.31326

Figure 8. RABGEF1 is recruited to the damaged mitochondria in a ubiquitin-binding dependent manner.

(A) HeLa cells transiently expressing mChery-Parkin and GFP-mRABGEF1 were treated with DMSO or valinomycin for 3 hr followed by immunostaining. The magnified pictures were shown in the right. Bars, 10 μm. (B) Total cell lysates of (A) were analyzed by immunoblotting. Anti-GFP antibody was used for the GFP-mRABGEF1 detection. * and # denote ubiquitinated forms and truncated forms, respectively. (C) Quantification of RABGEF1 recruitment to damaged mitochondria in (A). None, partial and complete denote that GFP-mRABGEF1 signals were overlapped with no, some of, and all mitochondria, respectively. (D) Recombinant ubiquitin (Ub) pre-treated with or without GST-TcPINK1 was subjected to pull-down assay with GST-mRABGEF1. W and E indicate wash and eluted fractions, respectively. 10%, 10% of input. (E) Percentages of the amount of ubiquitin in the eluted fraction in (D) were shown. The error bars represent mean ±SE from three independent experiments. (F) K48-linked and K63-linked Ub chains pre-treated with or without GST-TcPINK1 were subjected to pull-down assay with GST-mRABGEF1. (G) Interactions between GST-mRABGEF1 (WT or Y26A/A58D) and ubiquitin or phosphorylated ubiquitin were measured by ITC. N, stoichiometry of binding.

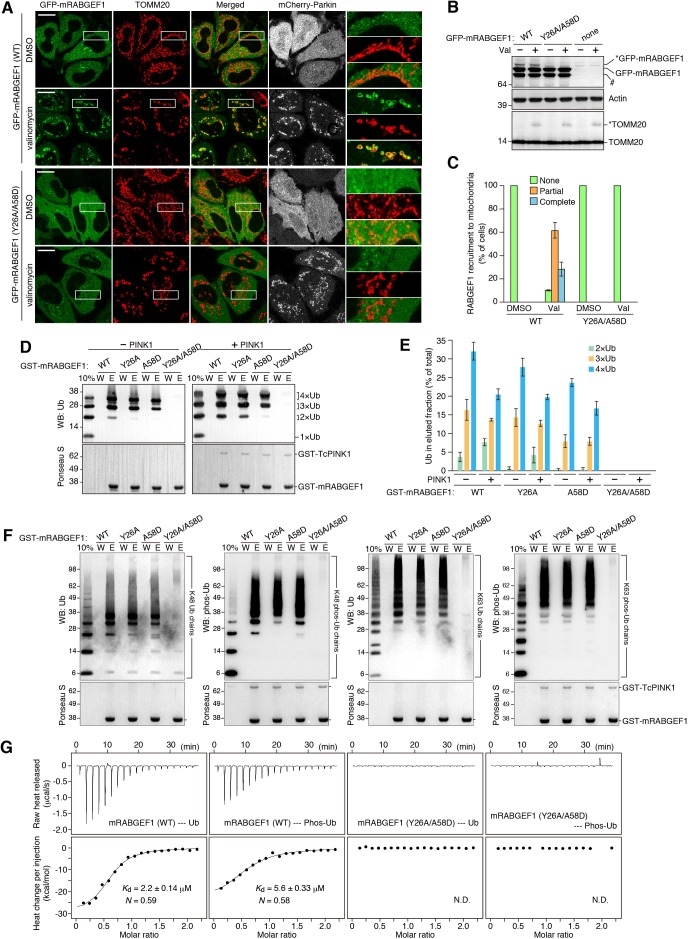
Figure 8—source data 1. Quantification of RABGEF1 recruitment to damaged mitochondria during mitophagy.
DOI: 10.7554/eLife.31326.028
Figure 8—source data 2. Binding affinities of recombinant GST-mRABGEF1 with ubiquitin or phosphorylated ubiquitin.
DOI: 10.7554/eLife.31326.029
Figure 8—source data 3. Binding affinities of recombinant GST-mRABGEF1 with ubiquitin or phosphorylated ubiquitin.
DOI: 10.7554/eLife.31326.030

Figure 8.

Figure 8—figure supplement 1. RABGEF1 recruitment to mitochondria during mitophagy.

Figure 8—figure supplement 1.

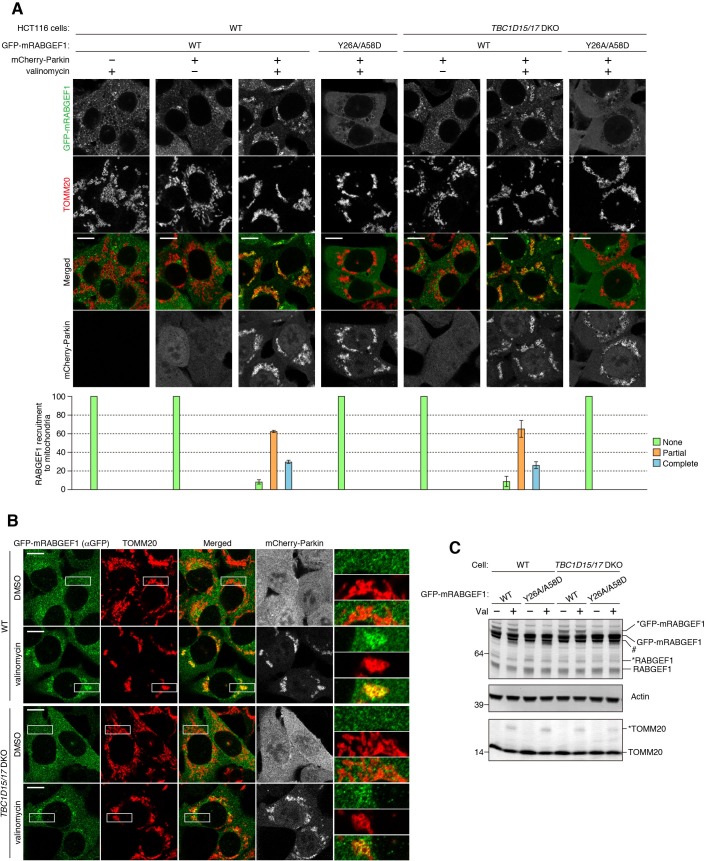
(A) The indicated cells were treated with DMSO or valinomycin for 3 hr followed by immunostaining. Bars, 10 μm. Graphs for quantification of RABGEF1 recruitment to mitochondria were shown below the images. None, partial and complete denote that GFP-mRABGEF1 signals were overlapped with no, some of, and all mitochondria, respectively. The error bars represent mean ±SE and over 100 cells were counted in each of three separate wells. (B) WT and TBC1D15/17 DKO HCT116 cells stably expressing mCherry-Parkin and GFP-mRABGEF1 were treated with DMSO or valinomycin for 3 hr. GFP-mRABGEF1 signals were enhanced by immunostaining with anti-GFP antibody. Bars, 10 μm. (C) Total cell lysates in (B) were analyzed by immunoblotting. * and # denote ubiquitinated forms and truncated forms, respectively.
Figure 8—figure supplement 1—source data 1. This excel file contains quantification of RABGEF1 (WT and Y26A/A58D mutant) recruitment to mitochondria in HCT116 (WT and TBC1D15/17 DKO) cells.
DOI: 10.7554/eLife.31326.031
Figure 8—figure supplement 2. Mitochondrial recruitment of RABGEF1 is not affected by the downstream Rabs and Rab-related factors.

Figure 8—figure supplement 2.

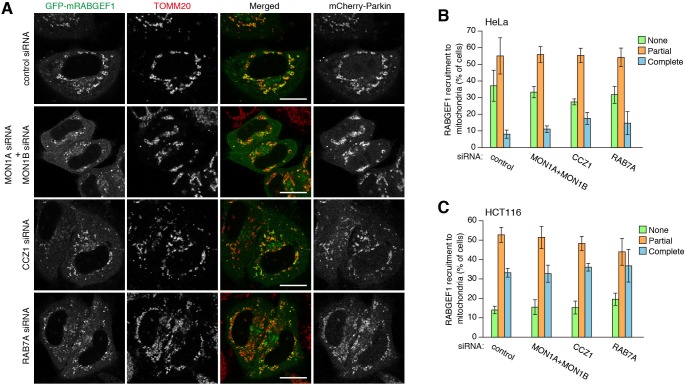
(A) GFP-mRABGEF1 was transiently expressed in siRNA-treated HeLa cells. The cells were then treated with valinomycin for 3 hr followed by immunostaining. Bars, 20 μm. (B) Quantification of mitochondrial recruitment of GFP-mRABGEF1 in HeLa cells. (C) Quantification of mitochondrial recruitment of GFP-mRABGEF1 in HCT116 cells. None, partial and complete denote that GFP-mRABGEF1 signals were overlapped with no, some of, and all mitochondria, respectively. The error bars represent mean ± SE and over 100 cells were counted in each of three separate wells.
Figure 8—figure supplement 2—source data 2. Quantification of RABGEF1 recruitment to mitochondria in HeLa cells treated with the indicated siRNA during mitophagy.
DOI: 10.7554/eLife.31326.032
Figure 8—figure supplement 2—source data 3. Quantification of RABGEF1 recruitment to mitochondria in HCT116 cells treated with the indicated siRNA during mitophagy.
DOI: 10.7554/eLife.31326.033
Figure 8—figure supplement 3. Preparation of recombinant RABGEF1 and ubiquitin.

Figure 8—figure supplement 3.

(A) CBB staining of purified recombinant GST-mRABGEF1. (B) CBB staining of purified recombinant tandem linear ubiquitin (1×, 2×, 3×, and 4×) each and the mixture. (C) Linear ubiquitins were incubated with or without GST-TcPINK1 followed by SDS-PAGE and immunoblotting. (D) CBB staining of purified recombinant GST-mRABGEF1 used for ITC. (E) Ubiquitin and phosphorylated ubiquitin purified from bacterial cells (see the Materials and methods for details) were analyzed by SDS-PAGE or Phos-tag PAGE followed by CBB staining.