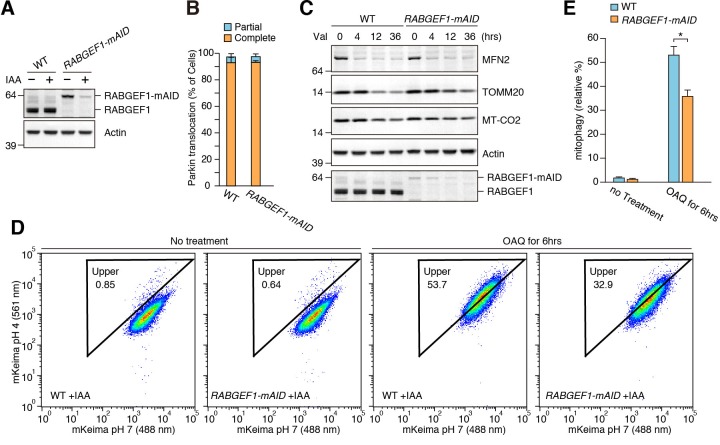
Figure 9. RABGEF1 is important for mitochondrial clearance.
(A) WT and RABGEF1-mAID HCT116 cells were treated with or without IAA for 16 hr. Total cell lysates were analyzed by immunoblotting. (B) Quantification of Parkin recruitment to mitochondria in WT and RABGEF1-mAID HCT116 cells after 3 hr of valinomycin treatment. Partial and complete denote that YFP-Parkin signals were overlapped with some of and all mitochondria, respectively. (C) YFP-Parkin stably expressing WT and RABGEF1-mAID HCT116 cells pre-treated with IAA were treated with valinomycin for the indicated times. Total cell lysates were analyzed by immunoblotting. (D) WT and RABGEF1-mAID HCT116 cells stably expressing YFP-Parkin and mt-mKeima were treated with IAA for 16 hr followed by DMSO or OAQ for 6 hr and subjected to FACS analysis. Plots are representative of n = 3 experiments. (E) Quantification of mitophagy in (D). Error bars represent mean ±SE of three independent experiments. Statistical differences were determined by student’s t-test. *p<0.05.

