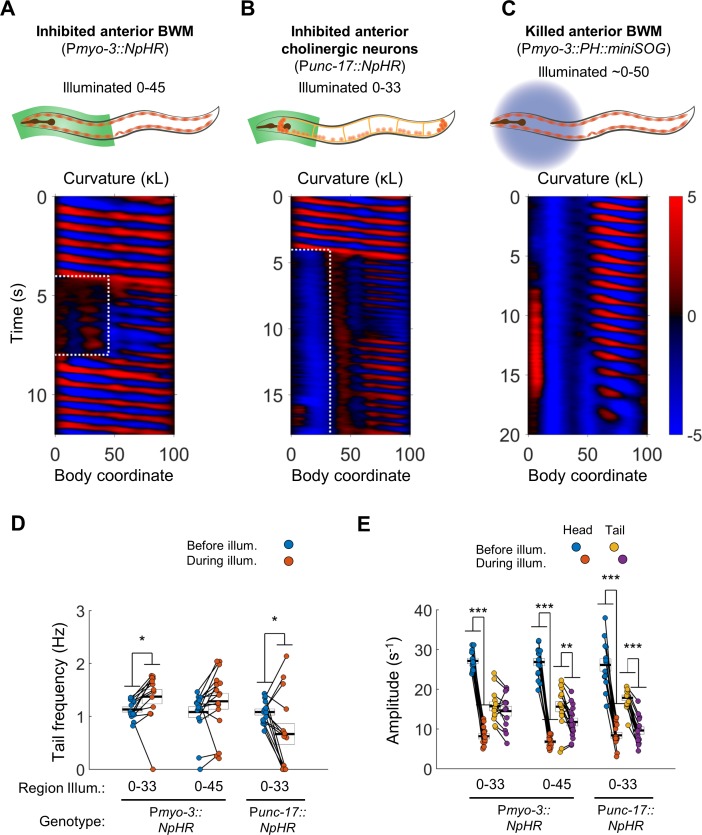
Figure 2. Anterior undulation is not required for posterior undulation.
(A) Inhibition of anterior BWMs (via Pmyo-3::NpHR) increases tail frequency. Body coordinates 0–45 were illuminated with green light (532 nm wavelength) to trigger relaxation of the anterior muscles. The spatiotemporal extent of green laser illumination is indicated by the white dotted box. (B) Inhibition of anterior cholinergic neurons (via Punc-17::NpHR; Punc-17::ChR2) does not prevent tail undulation. Body coordinates 0–33 were illuminated with green light to optogenetically inhibit anterior motor activity. (C) Tail undulations persist despite paralysis of the anterior BWMs due to miniSOG-mediated lesion of muscle cells. Animals were subjected to mechanical stimulation to induce locomotion (see Materials and methods). A total of nine animals were illuminated with blue light (472 nm wavelength) in approximately their anterior halves. Of these, five displayed partial-body forward swimming as depicted here, three were immobile, and one was not sufficiently paralyzed in the head. Six control worms, which were mounted identically but not illuminated, all displayed waves propagating normally from head to tail (not shown). (D) Inhibition of some anterior muscles (body coordinate 0–33, N = 10 worms) significantly increases tail frequency. Inhibition of most anterior muscles (0–45, N = 10 worms), or inhibition of anterior cholinergic neurons (N = 14 worms) produces mixed results; some animals generate high frequency tail oscillations while others slow down. Each colored circle represents one trial; worms may have multiple trials. Tail frequency is measured at body coordinate 85. Error boxes represent the mean and SEM. (E) Amplitude of undulation in the head and tail before and during muscle or neuron inhibition. Head frequency is measured at body coordinate 15. Note sharp decreases in head amplitude during all three manipulations. Amplitude here and henceforth is measured as the root mean square of the time derivative of the curvature times worm length and has units of s−1. (*) p<0.05; (**) p<0.01; (***) p<0.001; paired t-test.


