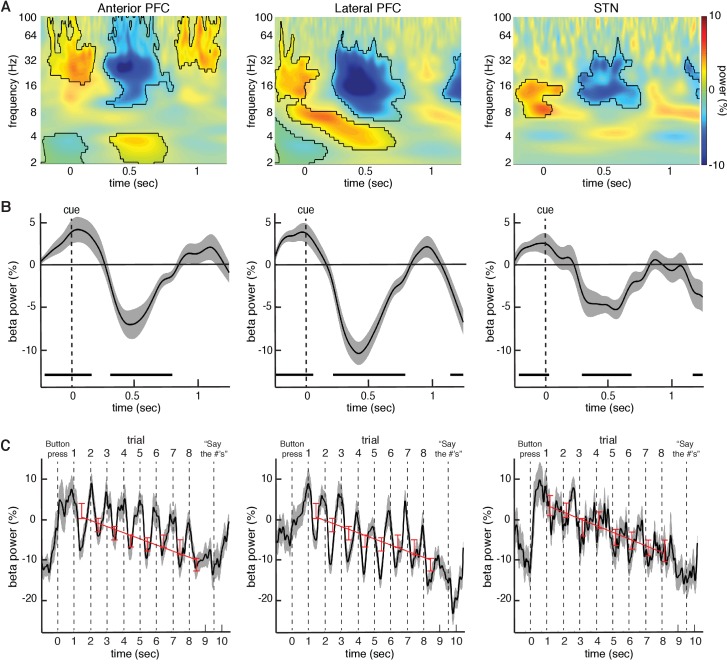
Figure 2. Changes in beta power during the task relative to baseline.
(A) Normalized oscillatory power averaged across all anterior PFC electrodes (left), all lateral PFC electrodes (middle), and all STN LFP macroelectrodes (right), averaged across all trials (target and distractor trials combined; numbers are presented at t = 0; mask indicates time frequency regions exhibiting significant differences from baseline at p < 0.05, corrected for multiple comparisons, permutation test). All three recording sites showed a decrease in beta (15–30 Hz) power during the task. (B) Same as (A), but averaged across the entire beta band. Time points exhibiting a significant change from baseline (p < 0.05, corrected for multiple comparisons, permutation test) are denoted by black horizontal bar. (C) Progressive changes in beta power across all eight trials within a block averaged across all blocks. As in (A), the data were averaged over all anterior PFC electrodes (left), lateral PFC electrodes (middle), and STN macroelectrodes (right). Stimuli were presented at t = 1, t = 2, t = 3, etc. Red bars: Average beta power at every trial within a block. Best fit line from a linear regression of beta power against trial number is shown. In all three brain regions, there was a significant overall decrease in beta power over time during each block of 8 trials (, repeated-measures ANOVA).


