. 2017 Dec 15;6:e31007. doi: 10.7554/eLife.31007

Figure 4. Differences in lateral PFC-STN coherence between target and distractor trials.

Cue-aligned time evolving normalized coherence between the STN and the lateral PFC for the target (A) and distractor (B) conditions. (C) Normalized coherence difference between the distractor and target conditions (mask indicates time frequency regions exhibiting significant differences at p < 0.05, corrected for multiple comparisons, permutation test). (D) Cue-aligned time evolving beta coherence changes plotted separately for the target and distractor conditions. Time points exhibiting a significant difference (p < 0.05, corrected for multiple comparisons, permutation test) are denoted by black horizontal bar.

Figure 4.

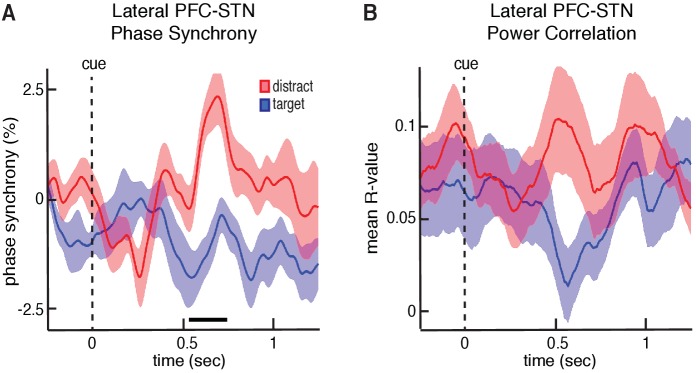
Figure 4—figure supplement 1. Trial-type-related differences in phase synchrony and power correlations Trial-type-related differences in phase synchrony and power correlations.

Figure 4—figure supplement 1.

(A) Same data as Figure 4D but only the phase values at each time point were used to calculate the synchrony between the STN and the lateral PFC. Time points exhibiting a significant difference (p < 0.05, corrected for multiple comparisons, permutation test) are denoted by black horizontal bar. (B) Same data as Figure 4D but only the power values at each time point were used to calculate the synchrony between the STN and the lateral PFC. Power synchrony was quantified by calculating at each time point the Spearman’s correlation coefficient between the STN and the lateral PFC power across trials.