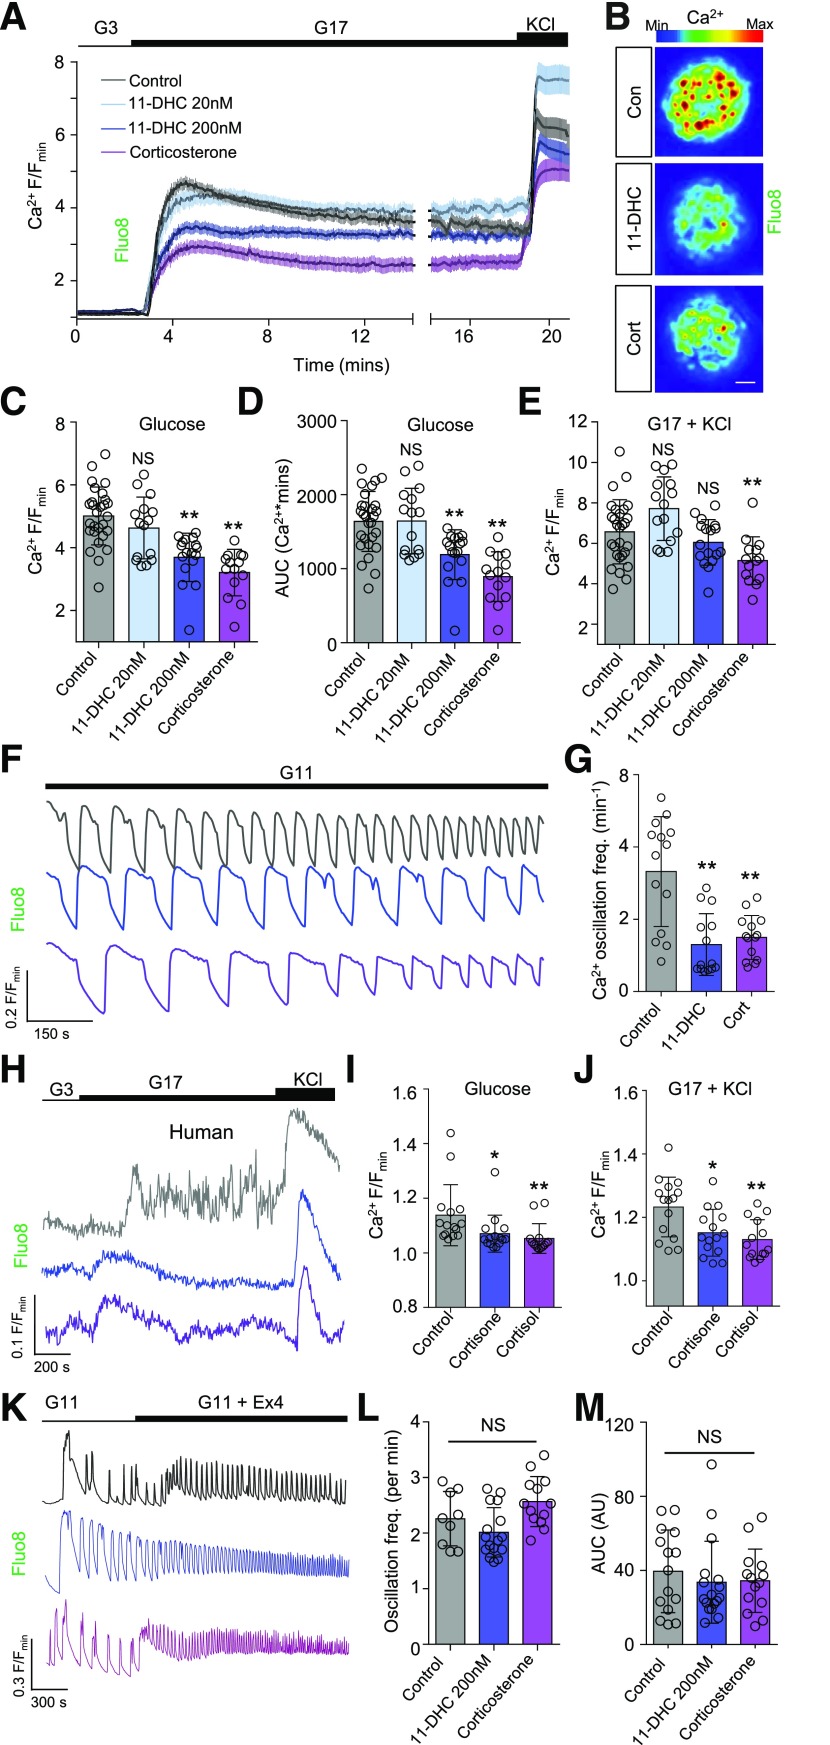
Figure 1.
Glucocorticoids suppress cytosolic Ca2+ fluxes in response to glucose and glucose + KCl. A: Mean ± SEM intensity-over-time traces showing glucose- and glucose + KCl–stimulated Ca2+ rises in mouse islets treated for 48 h with 11-DHC or corticosterone (n = 14–28 islets from six animals). B: Representative maximum intensity projection images showing impaired Ca2+ signaling in glucose-stimulated islets treated with control, 200 nmol/L of 11-DHC, and corticosterone (scale bar = 20 μm) (images cropped to show a single islet). C: Summary bar graph showing a significant reduction in the amplitude of glucose-stimulated Ca2+ rises after treatment with either glucocorticoid (n = 14–28 islets from six animals). D: As for C, but AUC. E: As for C, but glucose + KCl. F: Corticosterone and 11-DHC significantly decrease Ca2+ spiking frequency at high glucose (representative traces shown) (n = 14 islets from three animals). G: As for F, but summary bar graph showing Ca2+ oscillations per minute. H: Cortisone 200 nmol/L and cortisol 20 nmol/L blunt glucose- and glucose + KCl–stimulated Ca2+ rises in human islets (representative traces shown) (n = 15–18 islets from three donors, 48 h). I and J: As for H, but summary bar graphs showing amplitude of Ca2+ responses to glucose (I) and glucose + KCl (J). K: 11-DHC and corticosterone do not affect Ca2+ responses to the incretin mimetic exendin-4 (Ex4) 10 nmol/L (representative traces shown) (n = 14–17 islets from three animals). L and M: As for K, but summary bar graphs showing oscillation frequency (L) and AUC (M). KCl was applied at 10 mmol/L. Corticosterone was applied at 20 nmol/L for 48 h. Traces in F, H, and K share the same F/Fmin scale but are offset in the y-axis. Unless otherwise stated, data are mean ± SD. *P < 0.05, **P < 0.01 by one-way ANOVA (Bonferroni post hoc test). AU, arbitrary unit; Con, control; Cort, corticosterone; freq., frequency; G3, 3 mmol/L glucose; G11, 11 mmol/L glucose; G17, 17 mmol/L glucose; max, maximum; min, minimum; NS, nonsignificant.

