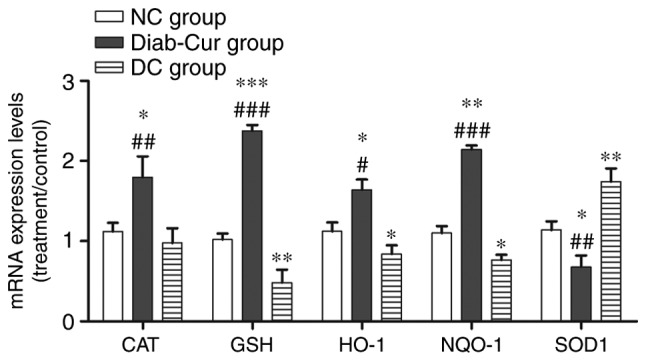
Figure 2.

Gene expression of several antioxidant response element-regulated genes. RNA was extracted from the liver, reverse-transcribed to cDNA and analyzed by reverse transcription-quantitative polymerase chain reaction for gene expression. The experiments used 18 samples from each group. Data are presented as the mean ± standard error. *P<0.05, **P<0.01 and ***P<0.001 vs. NC group; #P<0.05, ##P<0.01 and ###P<0.001 vs. DC group. NC, negative control; DC, diabetic control; Diab-Cur, diabetic with 1.0% curcumin treatment; HO-1, heme oxygenase-1; NQO-1, norvegicus NAD(P)H quinone dehydrogenase 1; GSH-Px, glutathione peroxidase; CAT, catalase; SOD1, superoxide dismutase 1.
