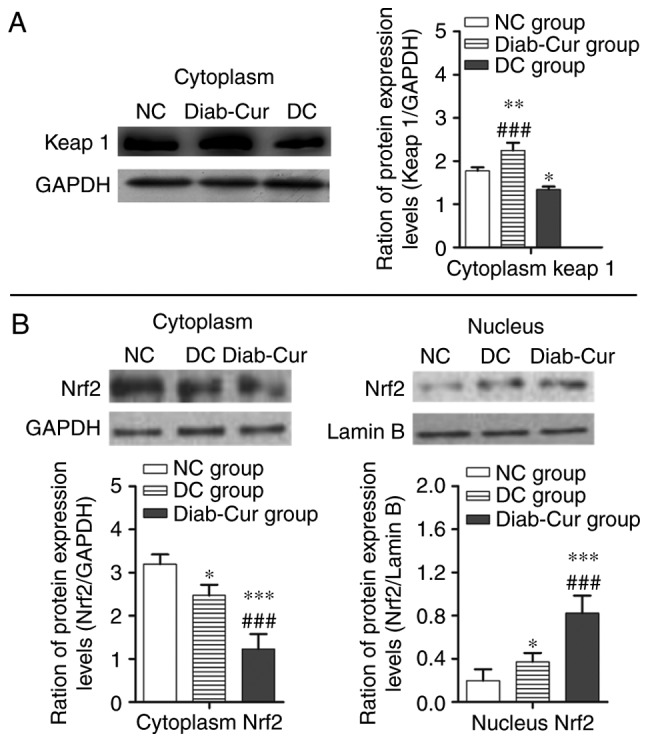
Figure 3.

Protein levels of the Keap1-Nrf2-ARE pathway. (A) Keap1 protein; (B) Cytosolic and nucleic Nrf2 levels. The experiments used 18 samples from each group. Data are presented as the mean ± standard error. *P<0.05, **P<0.01 and ***P<0.001 vs. NC group; ##P<0.01 and ###P<0.001 vs. DC group. Keap1, Kelch-like ECH-associated protein 1; Nrf2, nuclear factor (erythroid-derived 2)-like 2; NC, negative control; DC, diabetic control; Diab-Cur, diabetic with 1.0% curcumin treatment.
