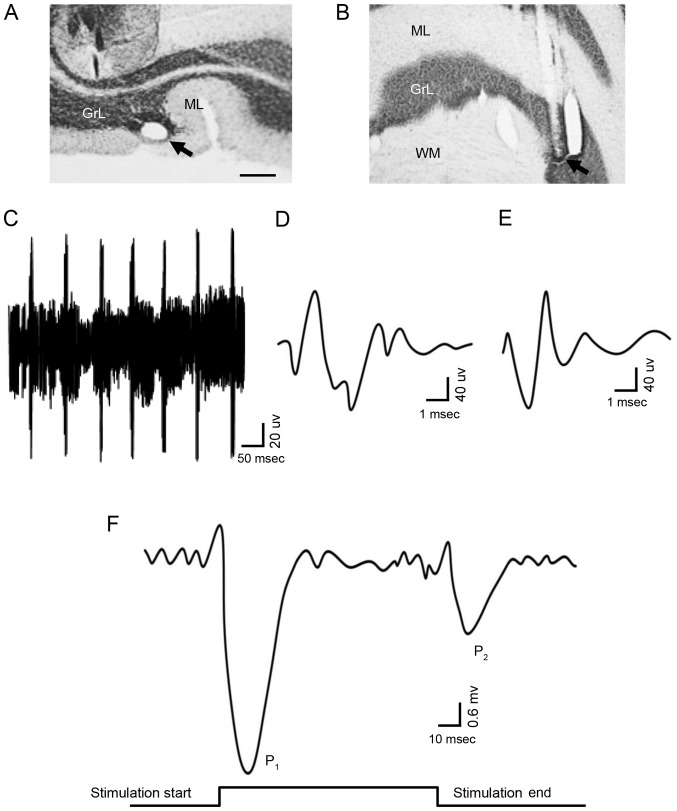
Figure 1.
Characteristics of field potential responses of PCs induced by sensory stimulation. The recording site in the PC layer is presented as (A) a cross section and (B) a longitudinal section; the arrows indicate the site (scale bar, 0.5 mm). (C) The signal-to-noise ratio was mediated to 5:1 in order to record the electric potential of PCs. The (D) complex spikes and (E) simple spike were considered to be markers of PCs. (F) The field potential responses of PCs induced by sensory stimulation is presented. There were two waves in the field potential of the PC layer: The P1 wave was caused by the onset of the stimulation, and the P2 wave was caused by the end of the stimulation. GrL, granular layer; ML, molecular layer; WM, white matter; PCs, Purkinje cells.

