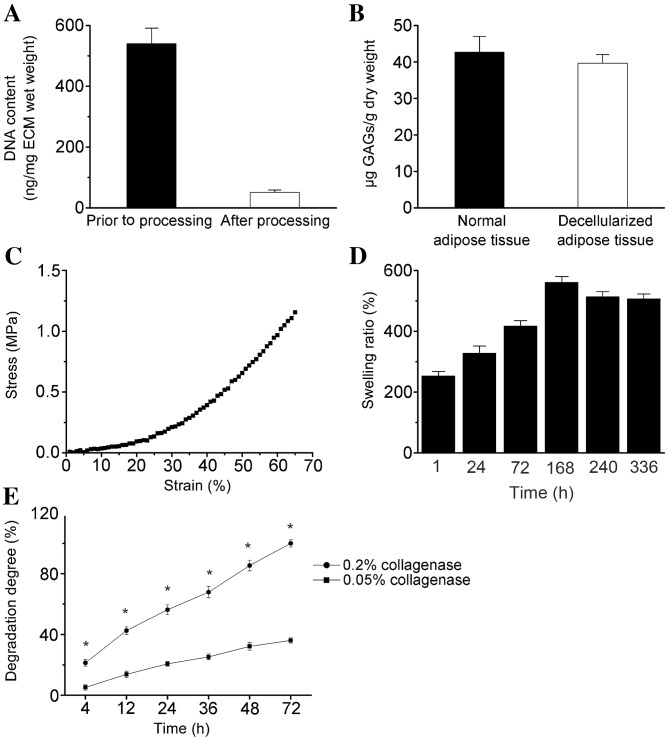
Figure 3.
Biochemical analysis of (A) residual DNA and (B) sulfated GAG content in adipose tissue-derived ECM scaffolds. (C) A representative stress-strain curve, (D) swelling ratio (E) and degradation profile of ECM scaffolds. Data were normalized to the dry weight of ECM, except for DNA content and stress-strain analysis. Data are presented as the mean ± standard deviation. *P<0.05 vs. 0.05% collagenase. GAG, glycosaminoglycan; ECM, extracellular matrix.

