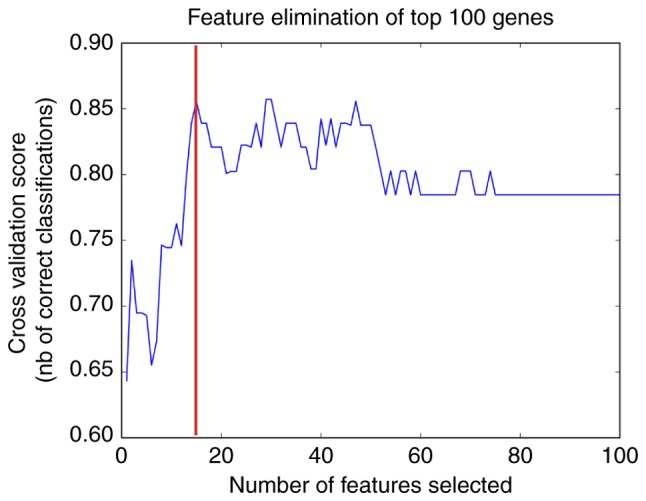
Figure 3.

Feature elimination of the top 100 feature genes. The x-axis is the feature gene number and the y-axis indicates the corresponding prediction precision. The gene combination with the highest precision is marked in red, which was a 15-gene combination.
