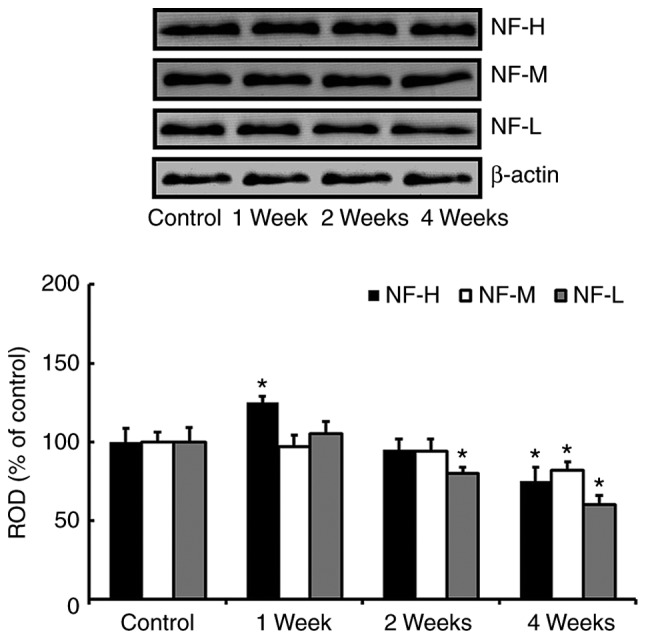
Figure 2.

Western blot analysis of NF-H, NF-M and NF-L in the hippocampus of the control and SCO-treated groups. ROD as percentages of the immunoblotting bands are also presented Data are presented as the mean ± standard error of the mean (n=7/group). *P<0.05 vs. control. NF-H, neurofilament-200 kDa; NF-M, neurofilament-165 kDa; NF-L, neurofilament-68 kDa; SCO, scopolamine; ROD, relative optical density.
