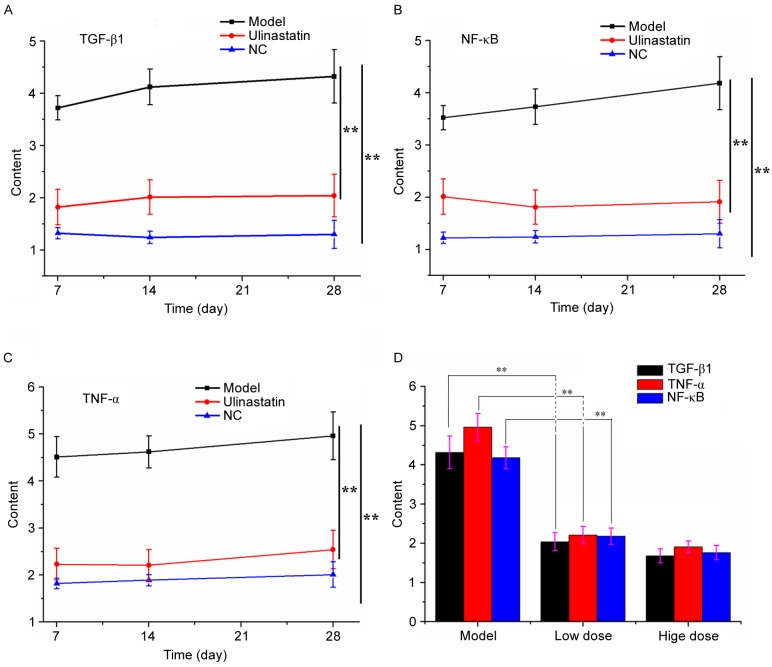
Figure 3.
Changes in the expression of TGF-β1, NF-κB and TNF-α throughout the experiment. Expression of (A) TGF-β1, (B) NF-κB and (C) TNF-α in the negative control, model and ulinastatin treatment group at 7, 14 and 28 days. **P<0.01 (D) Comparison of TGF-β1, NF-κB and TNF-α between the modeling group, low dose UTI treatment group (20,000 U/kg body weight/day) and high dose treatment group (100,000 U/kg body weight/day). Data are presented as the mean ± standard deviation. **P<0.01 vs. the control group. UTI, ulinastatin; NC, negative control; TGF-β1, transforming growth factor-β1; NF-κB, nuclear factor-κB; TNF-α, tumor necrosis factor-α.

