
Figure 4.
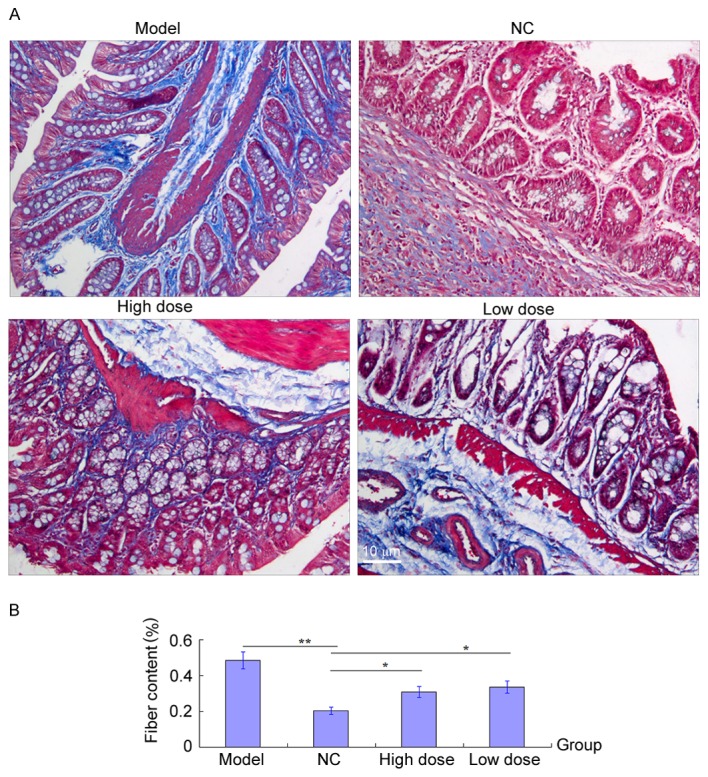
Masson staining. (A) Lung tissues from the control, modeling and ulinastatin low dose (20,000 U/kg body weight/day) and high dose (100,000 U/kg body weight/day) group (magnification, ×400). (B) Percentage of collagen fibrils within the field of vision. Three parallel tissue sections were evaluated. Data are presented as the mean ± standard deviation. *P<0.05, **P<0.01. NC, negative control.