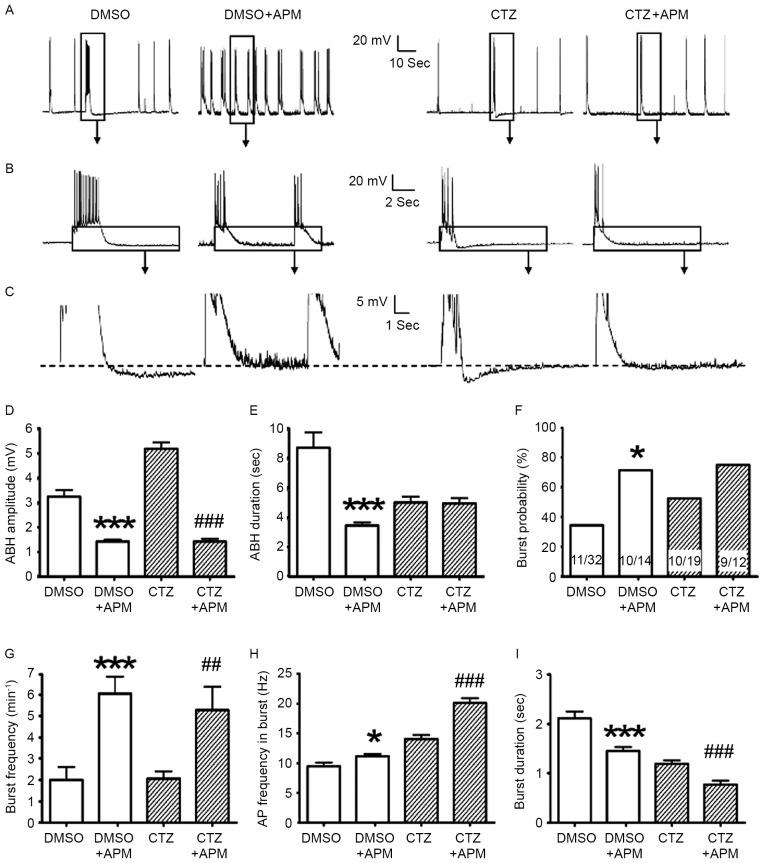
Figure 3.
APM impaired ABH; however, it also enhanced burst activities. (A-C) Comparisons between the original recording traces with and without 500 nM APM in the control and 5 µM CTZ group for 2 h. The boxes indicate the area that has been enlarged in the subsequent images. (D) APM significantly suppressed the amplitude of ABH in the control group (n=47 without APM; n=64 with APM) and the CTZ group (n=35 without APM; n=61 with APM). (E) APM reduced the duration of ABH in the control group; however, this was not observed in the CTZ group. (F) APM increased the percentage of neurons exhibiting burst activities in the control group; however, not in the CTZ group. The numbers written in the bars represent the number of cells (number with burst activities/total number). (G) APM significantly increased the burst number per minute, in the control group (n=11 without APM; n=10 with APM) and the CTZ group (n=10 without APM; n=9 with APM). (H) AP frequency in burst increased with the application of APM, in the control and CTZ groups. (I) Burst duration significantly decreased in the control and CTZ groups when the bath solution contained APM. Data in D, E, H and I represent the number of burst activities, whereas that in (G) represent the number of neurons. Data are presented as the mean ± standard error mean. *P<0.05, ***P<0.001 DMSO vs. DMSO + APM; ##P<0.01, ###P<0.001 CTZ vs. CTZ + APM. APM, apamin; ABH, after burst hyperpolarization; CTZ, cyclothiazide; AP, action potential.

