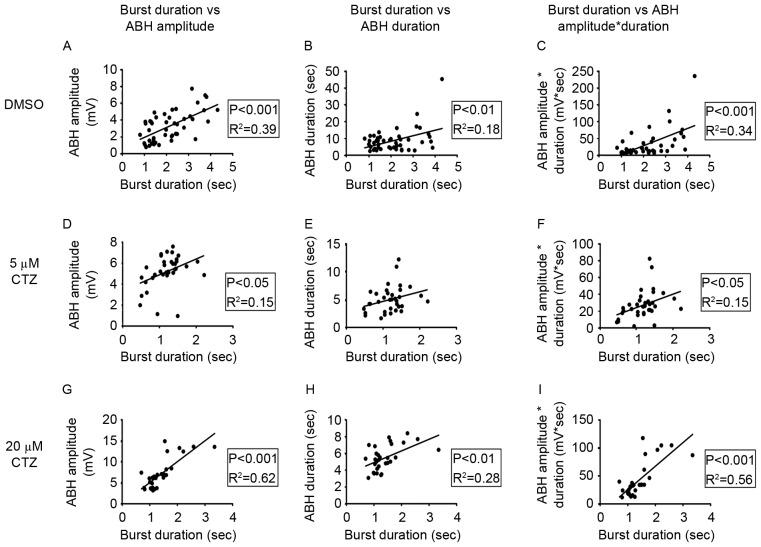
Figure 5.
A positive correlation was identified for burst duration, ABH amplitude, ABH duration, and the product of ABH amplitude and duration, in the DMSO and CTZ groups. (A-C) Correlation analyses in the DMSO group, of burst duration with either ABH amplitude, ABH duration or the product. A significant positive linear correlation was observed in all parameters when using linear regression. (D-F) Correlation analyses in the 5 µM CTZ group. Only ABH amplitude and the product exhibited a significant positive linear correlation with burst duration. (G-I) Correlation analyses in 20 µM CTZ group. All analyses produced significant positive correlations. Data points in each figure represent all bursting activities from the neurons of each group. ABH, after burst hyperpolarization; CTZ, cyclothiazide.

