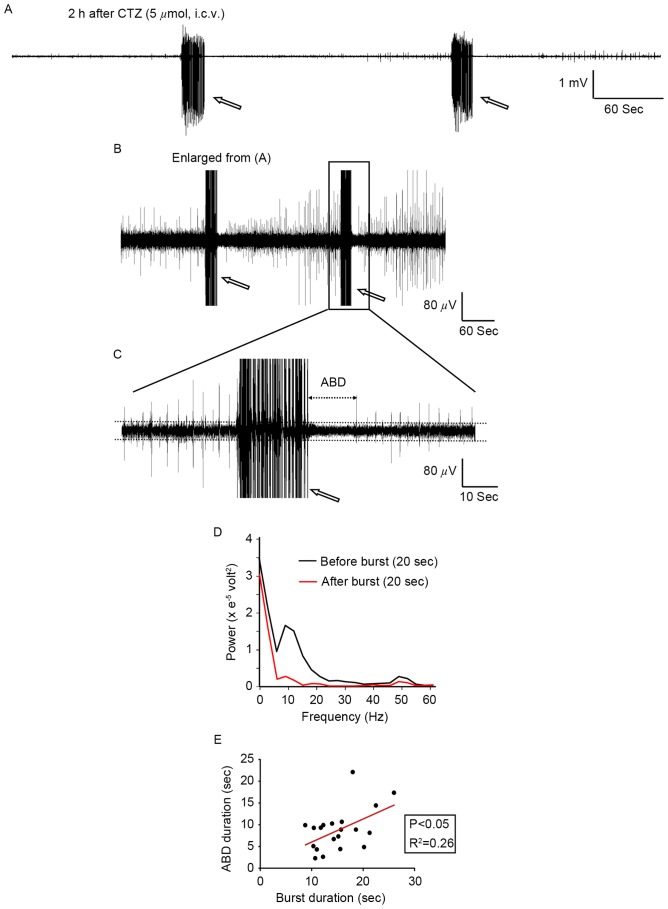
Figure 7.
CTZ induced epileptiform burst activities in the hippocampal area followed by a period of activity depression in anaesthetized rats. (A-C) Representative electroencephalogram recordings revealing the period of ABD following burst activities (indicated by arrows). The box in recording (B) indicates the area that has been enlarged in image (C). (D) Power analysis of baseline activities in 20 sec demonstrated that there was a decrease in power after burst activities when compared with before burst activities. (E) A positive correlation was identified between burst duration and ABD duration. Bursts with a longer burst duration also had a longer ABD duration. Data points in (E) represent the values of single burst activities. CTZ, cyclothiazide; ABD, after burst depression.

