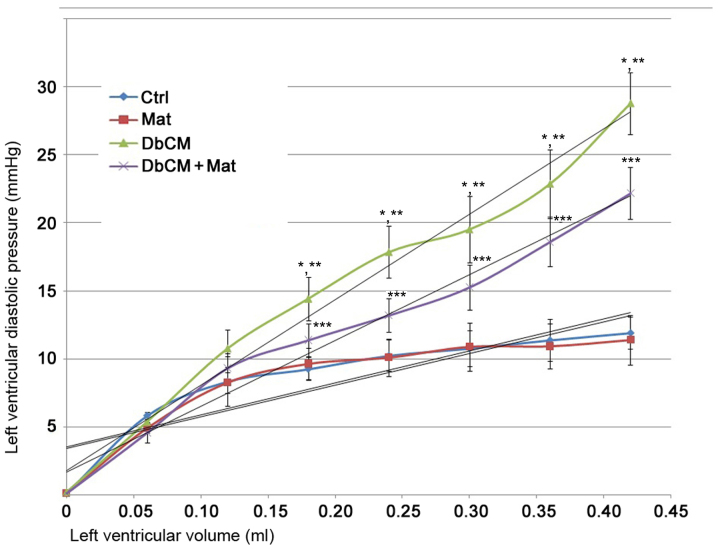
Figure 1.
Cardiac compliance detection and plotting in isolated hearts. The line chart in this figure demonstrates the P-V (left ventricular diastolic pressure-left ventricular volume) curve of isolated hearts from the Ctrl, Mat, DbCM and DbCM+Mat groups. Results are presented as the mean ± standard deviation. Approximately linear trends are shown. *P<0.05 vs. Ctrl; **P<0.05 vs. Mat; ***P<0.05 vs. DbCM. Ctrl, control; Mat, matrine; DbCM, diabetic cardiomyopathy.

