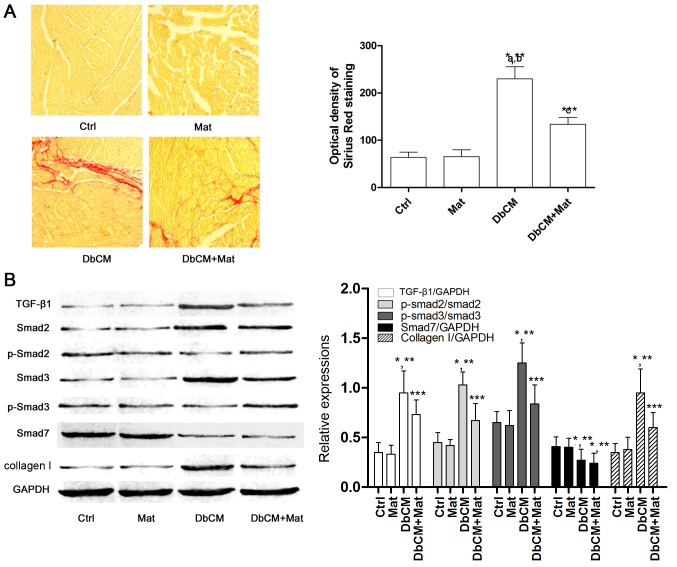
Figure 2.
Collagen deposition and TGF-β1/Smad signaling pathway activation in cardiac tissue. (A) In the left part of the figure, captured images of Sirius Red staining of cardiac tissue harvested from each group (Ctrl, Mat, DbCM and DbCM+Mat) are shown. The bar chart on the right shows the values of the optical densities of Sirius Red in each group (results are presented as the mean ± standard deviation). (B) Immunoblots of TGF-β1, Smad2, phospho (p)-Smad2, Smad3, p-Smad3, Smad7, collagen I and the loading control, GAPDH, are shown. The bar chart on the right shows the relative expression levels of TGF-β1 (TGF-β1/GAPDH), Smad7 (Smad7/GAPDH), phosphorylated Smad2 (phospho-Smad2/Smad2), phosphorylated Smad3 (phospho-Smad3/Smad3) and collagen I (collagen I/GAPDH). *P<0.05 vs. Ctrl; **P<0.05 vs. Mat; ***P<0.05 vs. DbCM. TGF-β1, transforming growth factor-β1. Ctrl, control; Mat, matrine; DbCM, diabetic cardiomyopathy.

