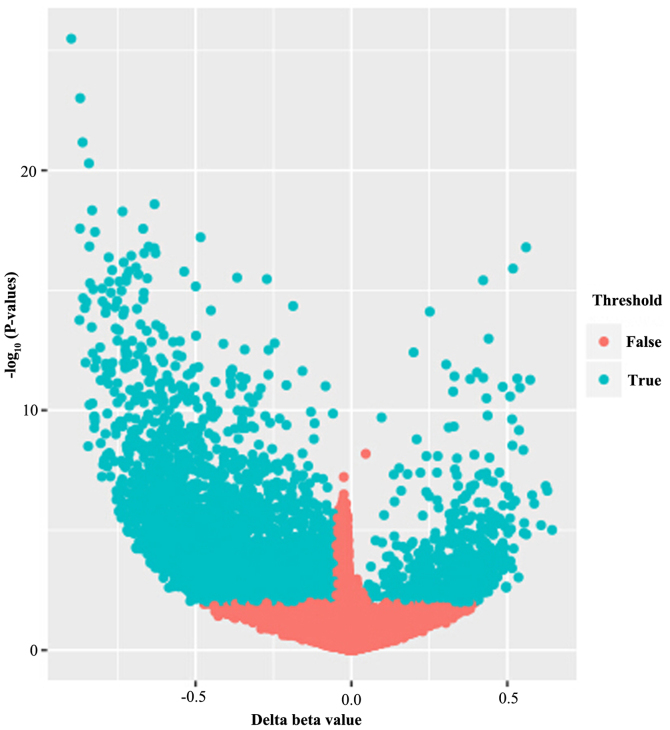
Figure 1.
Volcano plot exhibiting the methylation data of 19 osteosarcoma and 6 normal samples. X axis, mean methylation differences between osteosarcoma and normal. Y axis, log transformed P-values. A total of 5,889 CpG sites were considered to be significantly differently methylated, exhibited in blue.

