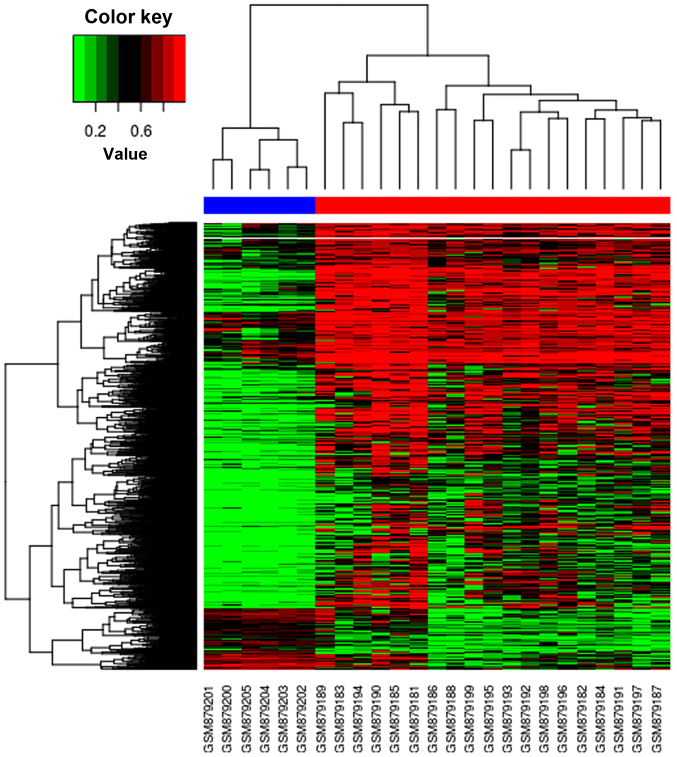
Figure 2.
Hierarchical clustering analysis of significantly differentially methylated CpGs between osteosarcoma and normal samples. DNA methylation across the 3,725 sites in each of the samples was analyzed by hierarchical clustering. Each row is an individual CpG site and each column is a different sample. Color gradation from green to red denotes low to high DNA methylation, with β-values ranging from 0 (no methylation; green) to 1 (complete methylation; red).

