Figure 2.
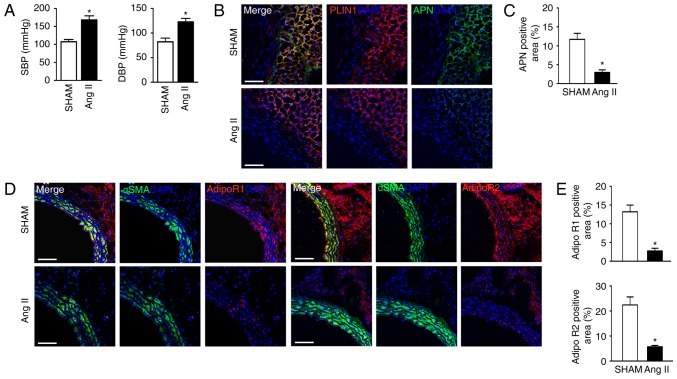
Expression and distribution of APN and its receptors in the vasculature. (A) Blood pressure measurements of SHAM and Ang II-infused mice. Representative immunofluorescence images of (B) APN+ and PLIN+ cells and (C) quantification of their protein levels and representative immunofluorescence images of (D) αSMA+, AdipoR1+ and AdipoR2+ cells and (E) quantification of their protein levels, in the perivascular adipocytes and VSMCs from sham and Ang II mice. DAPI counterstained for the nucleus. Scale bar, 100 µm. Data are expressed as the mean ± standard deviation (n=5). *P<0.05 vs. sham. APN, adiponectin; Ang, angiotensin; VSMC, vascular smooth muscle cell; AdipoR, adiponectin receptor; SBP, systolic blood pressure; DBP, diastolic blood pressure; αSMA, α smooth muscle actin; PLIN, perilipin.

