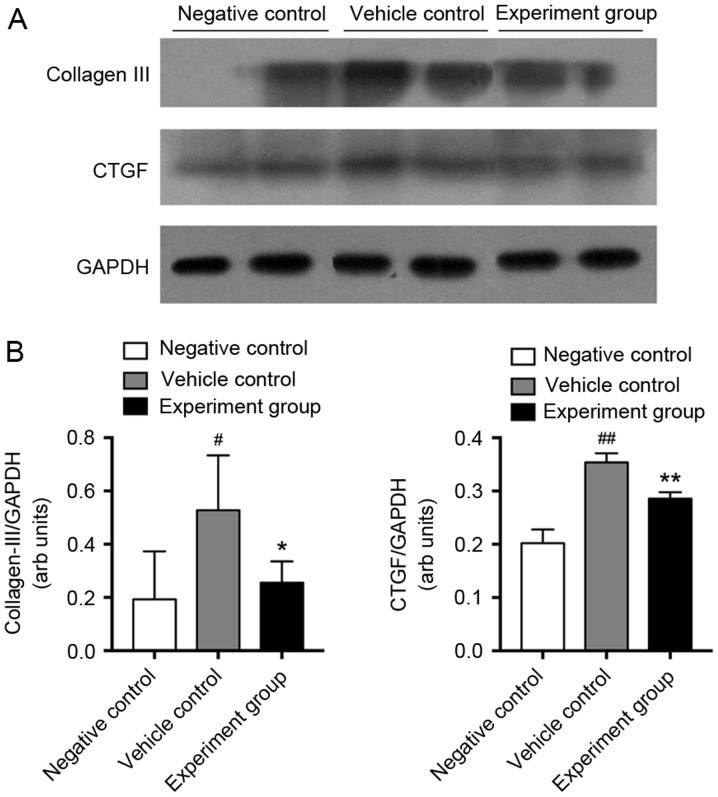
Figure 3.
Western blot analysis of CTGF and collagen III expression in negative control, vehicle control, and experimental rats. (A) Western blot analysis of immunolabeled bands for CTGF and collagen III, with GAPDH as an internal control. (B) Ratio of the mean density values of CTGF and Col III relative to GAPDH. #P<0.05, ##P<0.01 vs. negative control; *P<0.05, **P<0.01 vs. vehicle control, n=8. CTGF, connective tissue growth factor.

