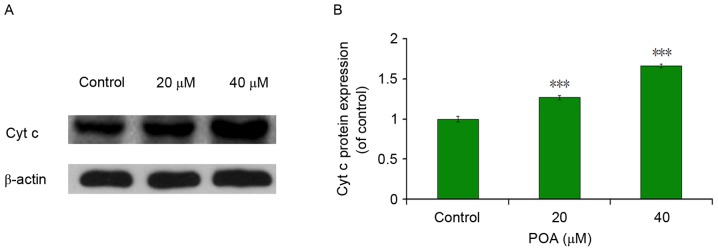
Figure 9.
Effect of POA on expression levels of cyt c in L-02 cells. β-actin served as an internal control. (A) Representative western blot images and (B) quantification from at least three experiments. Data are presented as the mean ± standard deviation. ***P<0.001. Cyt c, cytochrome c; POA, oxalicumone A.

