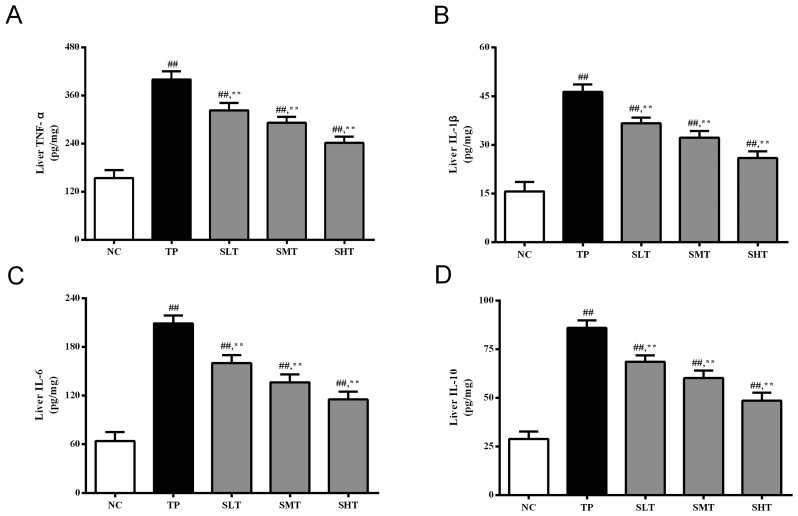
Figure 4.
Effect of silymarin on inflammatory cytokines in the liver. ELISAs were performed to determine the levels of (A) TNF-α, (B) IL-1β, (C) IL-6 and (D) IL-10 in the liver of rats in different treatment groups. Data are presented as the mean ± standard deviation, n=12. ##P<0.01 vs. NC group; **P<0.01 vs. TP group. TNF, tumor necrosis factor; IL, interleukin; NC, normal control; TP, triptolide; SLT, low-dose silymarin treatment; SMT, middle-dose silymarin treatment; SHT, high-dose silymarin treatment.

