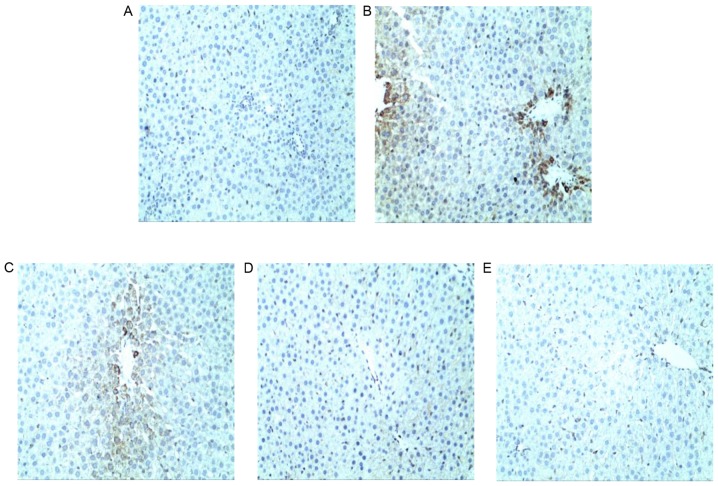
Figure 8.
Immunohistochemical staining of Bax in liver sections. (A) Bax staining in the NC group. (B) In the TP group, the Bax-positive area was markedly larger compared with the NC group. Bax staining in (C) SLT, (D) SMT and (E) SHT groups indicated that the expression of Bax was markedly reduced compared with the TP group in a dose-dependent manner. Magnification, ×200. Bax, Bcl-2-associated X; NC, normal control; TP, triptolide; SLT, low-dose silymarin treatment; SMT, middle-dose silymarin treatment; SHT, high-dose silymarin treatment.

