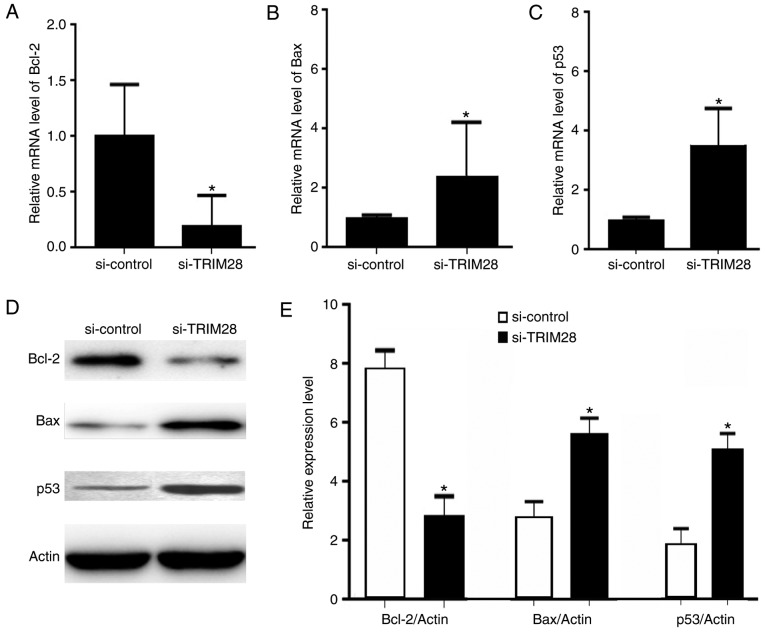
Figure 3.
TRIM28 knockdown induced a decrease in Bcl-2 expression and an increase in Bax and p53 expression. (A-C) Comparison of the mRNA expression levels of Bcl-2, Bax and p53 in the TRIM28-siRNA and control-siRNA groups by RT-qPCR. (D). Western blot analysis of the protein expression of Bcl-2, Bax, and p53 in the two groups. (E) Comparison of the protein expression levels of Bcl-2, Bax, and p53 in the two groups. *P<0.001 vs. si-control. Bcl-2, B cell lymphoma-2; Bax, Bcl-2 associated X protein; si, small interfering; RT-qPCR; reverse transcription-quantitative polymerase chain reaction.

