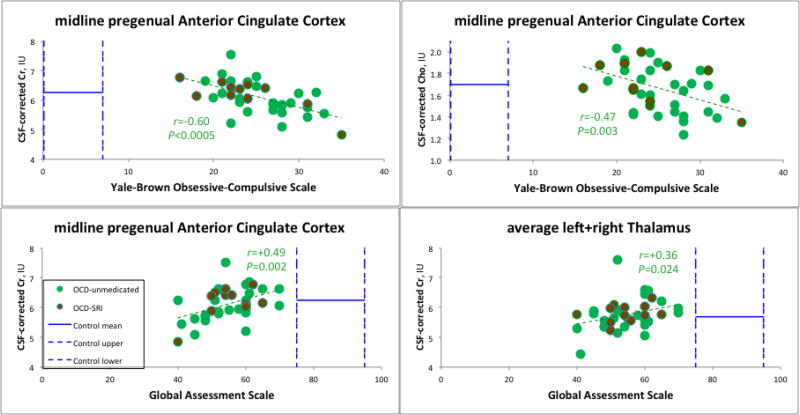
Fig. 3.
MRS Cr and Cho drop with increasing OCD symptoms; Cr rises with increasing functioning. pACC Cr and Cho levels in OCD are close to normal means (horizontal solid blue bars), yet vary significantly with psychiatric symptoms. Symptoms themselves are outside normal ranges, indicated by vertical dashed blue bars marking measured control (GAS) or standard subclinical (YBOCS) ranges. [A] Cr and [B] Cho in pACC drop with increasing obsessive-compulsive symptoms. Cr in pACC [C] and thalamus [D] rises with increasing global functioning. (Not shown) Cr and Cho in pregenual cingulate and also anterior middle cingulate similarly drop with increasing depressive symptoms. For abbreviations, see Figs. 1–2.

