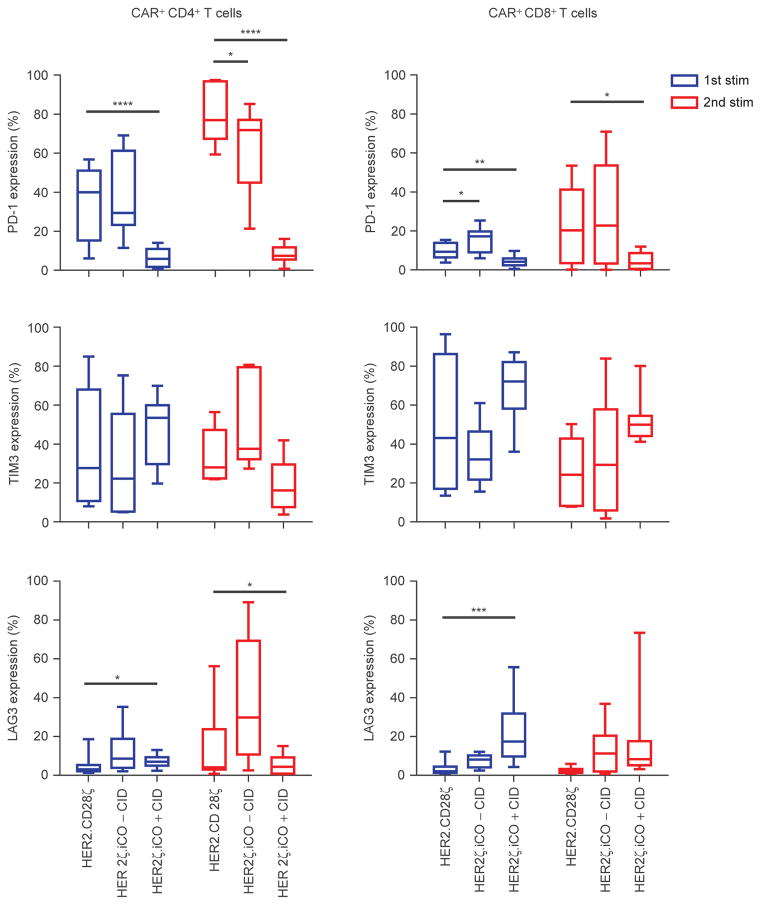
Figure 4.
HER2ζ.iCO T cells have reduced PD-1 surface expression after repeat stimulations. CD4+ and CD8+ CAR T cells were analyzed for PD-1, TIM3, and LAG3 surface expression 7 days after stimulation (stim) with HER2-positive cells with or without CID (0.5 and 5 nmol/L data combined). HER2. CD28ζ T cells served as control (mean; n = 3 donors; 2–3 HER2-positive cell lines per donor; one-way ANOVA). All statistical analysis was done compared with HER2.CD28ζ T cells (*, P < 0.05; **, P < 0.01; ***, P < 0.001; ****, P < 0.0001).

