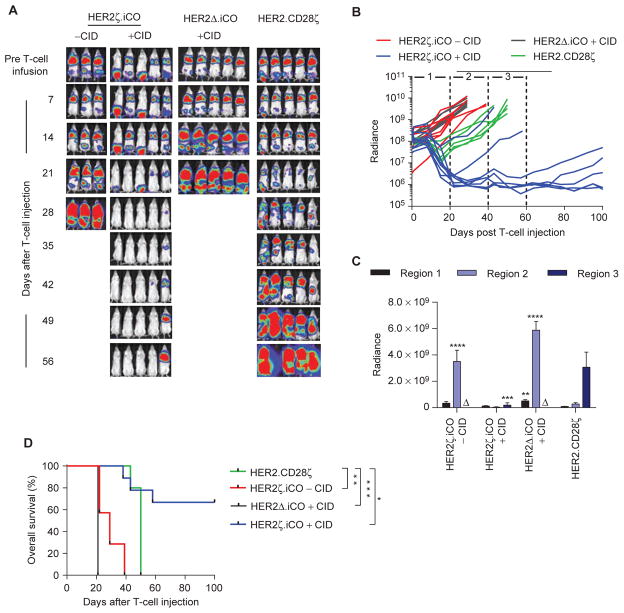
Figure 5.
HER2ζ.iCO T cells have superior antitumor capability in vivo compared with HER2.CD28ζ T cells. LM7.eGFP.ffluc cells (2 × 10⁶) were injected into NSG mice intravenously. On day 28, 3 × 10⁵ HER2ζ.iCO, HER2Δ.iCO, or HER2.CD28ζ T cells were injected intravenously. Mice were injected with one dose of CID (100 μg) or vehicle control intraperitoneally (−CID) on the same day of T-cell injection. Bioluminescence imaging was used to follow tumor growth in mice. A, Images of representative animals are shown. B, Bioluminescence signal (radiance = photons/sec/cm2/sr). Region 1: <20 days, region 2: 20≤ to <40 days; region 3: 60≤ to <60 days after T-cell injection. C, Pooled bioluminescence data for each region (mean + SEM; Δ: all mice euthanized; **, P < 0.01; ***, P < 0.001; ****, P < 0.0001; one-way ANOVA). D, Kaplan–Meier survival curve of HER2ζ.iCO T cells + vehicle control (n = 7), HER2ζ.iCO T cells + CID (n = 9), HER2Δ.iCO T cells + CID (n = 10) and HER2.CD28ζ T cells (n = 5; *, P < 0.05; **, P < 0.01; ***, P < 0.001; log-rank test). All statistical analysis was done compared with HER2.CD28ζ T cells.

