Figure 1.


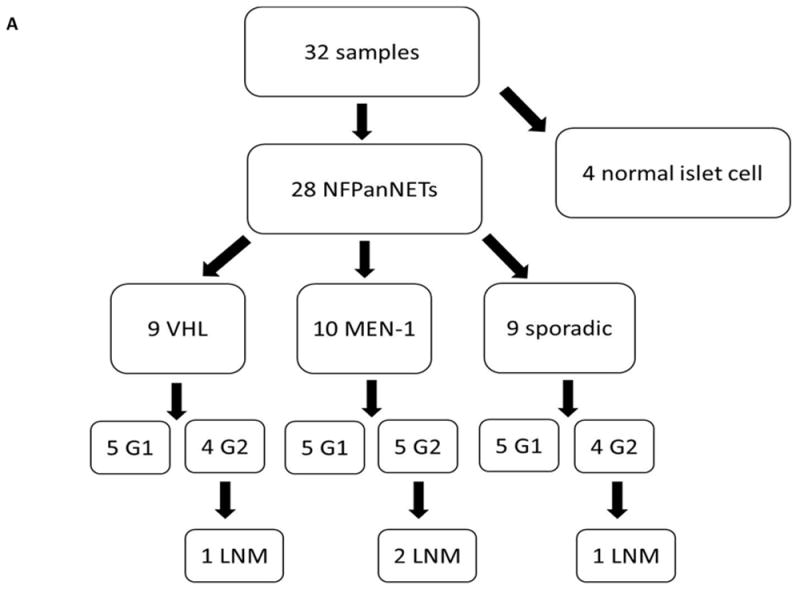
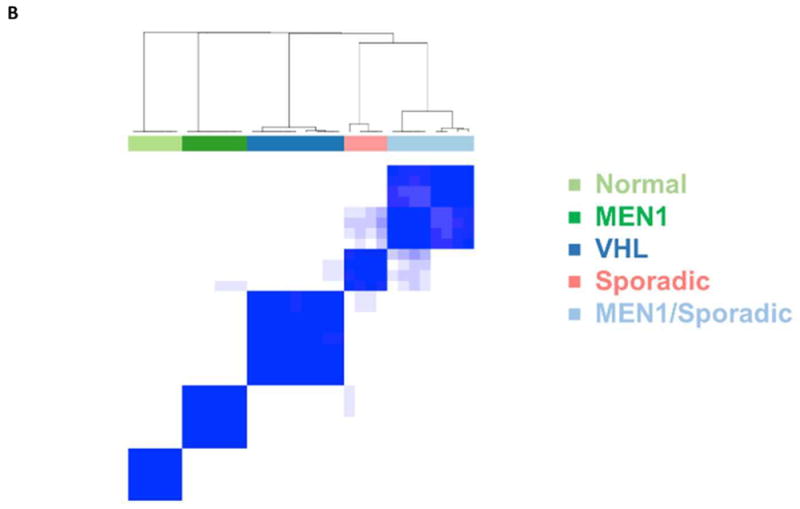
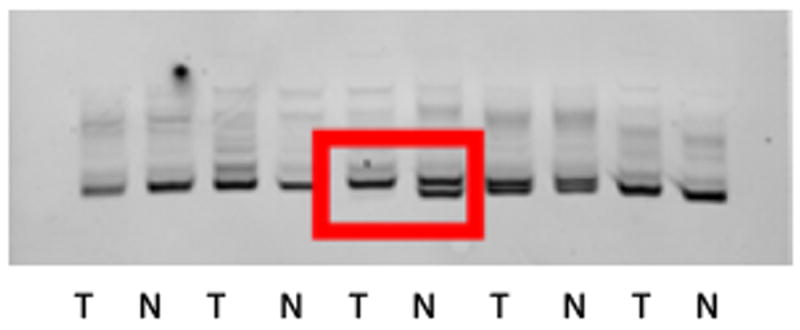
A. Breakdown of PanNET and normal islet cell samples analyzed by cDNA microarray (G=Grade, LNM=Lymph Node Metastases). B. Unsupervised hierarchical clustering of microarray data defines five distinct groups. C. Representative image of loss of heterozygosity for the MEN1 gene in a sporadic NFPanNET using microsatellite marker DS11S956 (red box).
T: Tumor, N: Normal
