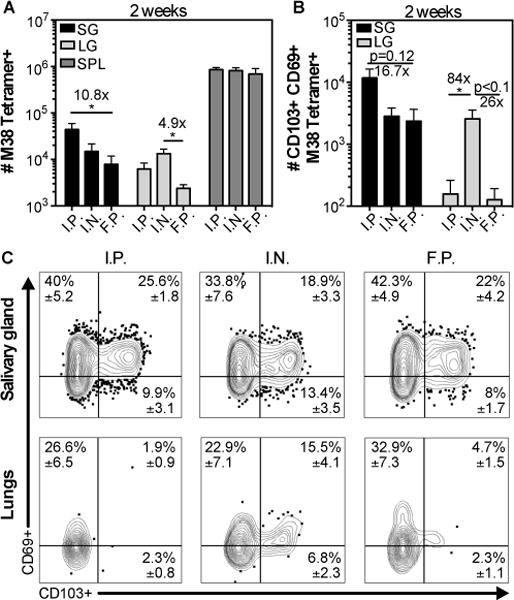
Fig. 1. MCMV-specific CD8+ T cells accumulate in the salivary gland after several routes of MCMV infection.

Mice were infected by intraperithoneal (i.p.), intranasal (i.n.) and footpad (f.p.) inoculation. Cells in the parenchyma or vasculature of each tissue were distinguished by I.V. staining as described in the materials and methods. A) Shown is the absolute number of M38 tetramer+ CD8+ T cells from the parenchyma of the salivary gland (SG) and lungs (LG), and from the overall CD8β+ population of the spleen two weeks after infection. B) Absolute number of CD103+ CD69+ M38 Tetramer+ cells in the SG and LG from the data shown in (A). Data are from 2 independent experiments (n=6 for f.p. and i.p.; n=5 for i.n.). Error bars represent the SEM and statistical significance was measured by one-way ANOVA after log10 transformation of the absolute numbers (*p<0.05). (C) Concatenated FACS plots from one representative experiment (n=2 i.n.; n=3 for i.p. and f.p.) of the CD69 and CD103 expression of M38 tetramer+ CD8+ T cells from the salivary gland (top panel), and the lungs (bottom panel). The mean frequency ± SEM in the indicated quadrant were calculated considering both experiments.
