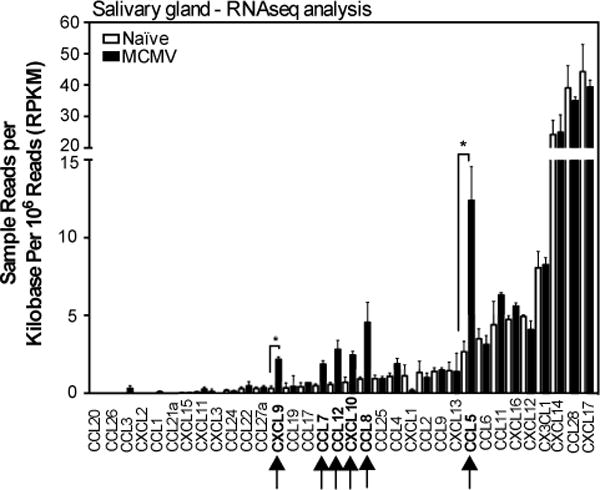
Fig. 5. Chemokine profile of the salivary gland after MCMV infection.

The array of chemokines expressed in the salivary glands of uninfected mice, or 14 days after MCMV infection. Shown are the sample reads per kilobase per million reads (RPKM) of chemokines to illustrate the relative abundance of different transcripts. The complete gene list of genes that were significantly differentially expressed is shown in Table S1A. The complete gene list sorted by fold change, regardless of significance, is shown in Table S1B. Data are from one experiment (n=3 mice per group). Error bars represent the SEM (↑=p< 0.05; *=FDR<0.05).
