
Fig. 9. CXCR3 blockade reduces the recruitment of CD8+ T cells to salivary glands in uninfected mice independently of IFNγ.
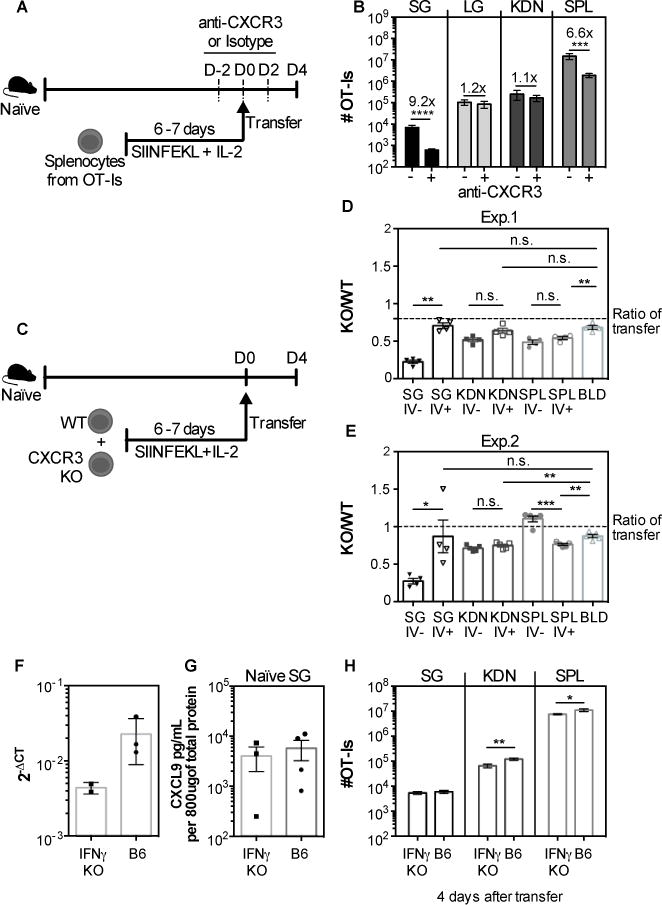
A) WT OT-I T cells were activated in vitro, treated with either anti CXCR3 antibody or isotype control and 4×10⁶ cells were transferred to naïve mice. The recipients were also treated with anti CXCR3 antibody or isotype control every other day starting 2 days before transfer until sacrifice. (B) The absolute numbers of OT-I T cells that reached the parenchyma of the salivary gland (SG), lungs (LG) and kidneys (KDN) and from the CD8β+ population of the spleen (SPL) are shown. Data are from 2 independent experiments (n=7 for the isotype treated group and n=8 for the group treated with anti-CXCR3). (C) Experimental design for figures D and E. WT and CXCR3 KO OT-Is were activated in vitro, and 4×10⁶ of each were mixed and co-transferred to naïve mice. (D-E) Shown is the ratio of KO/WT OT-Is in the vasculature (I.V.−) and parenchyma (I.V.+) of the SG, KDN, SPL, and from the overall CD8β+ cells in the blood. Two independent experiments are shown in D and E (n=4 in D and n=5 in E). The dotted lines represent the ratio of KO to WT cells in the transferred pool (as assessed by FACS on the day of transfer). Error bars represent SEM. Statistical significance was measured by unpaired t-test after log10 conversion of the absolute numbers (B) and ratio paired t-test in (D-E). The levels of CXCL9 in the SG of naïve B6 and IFN-γ KO mice were determined by qPCR (F) and ELISA (G). Data from one experiment (n=2-3 in F; n=3-4 in G). H) WT OT-I were activated in vitro and 4×10⁶ T cells were transferred to naïve B6 or IFN-γ KO mice (similarly to A and B). Four days after transfer the organs were collected and the overall number of OT-I in the SG, KDN and SPL are shown. Data are pooled from 2 independent experiments (n=6 B6 mice and 7 IFN-γ KO mice). Error bars represent the SEM and the statistical significance was measured by unpaired t-test after log10 conversion of the absolute numbers (*p<0.05; **p<0.01).