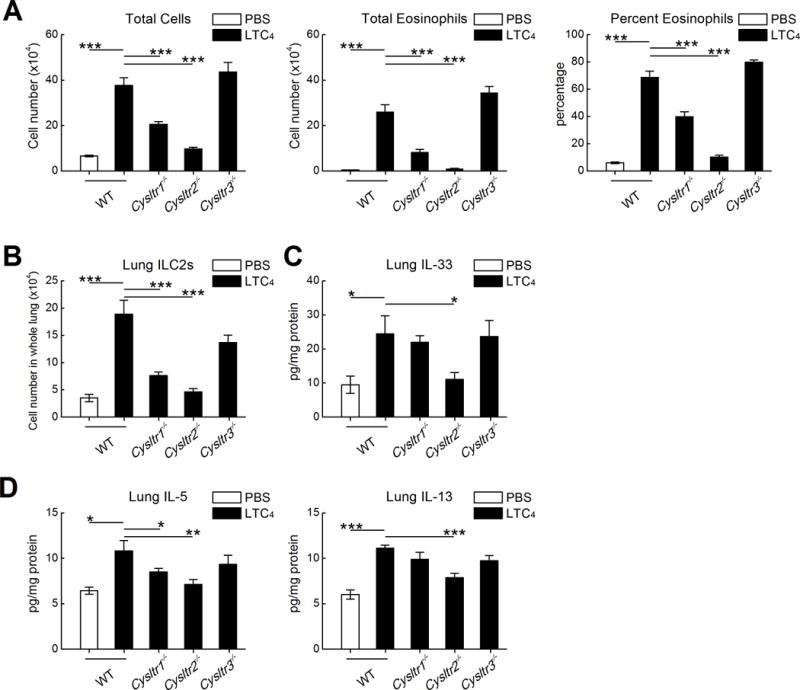
Figure 5. CysLT1R and CysLT2R contribute separately to LTC4-induced ILC2 expansion.

OVA sensitized mice of the indicated genotypes received challenges with 0.1% OVA on three successive days. The indicated groups of mice received 2.2 nmol of LTC4 or control. A. Total BAL fluid cell counts (left), eosinophil counts (middle) and percentages of eosinophils (right). B. Total numbers of lung ILC2s from the same mice as in A. C. Levels of IL-33 detected in whole lung lysates from the indicated mice. D. Levels of IL-5 (left) and IL-13 (right) proteins in the same samples as in C. Results are from 10 mice/group. *** P < 0.001, ** P < 0.01, * P <0.05.
