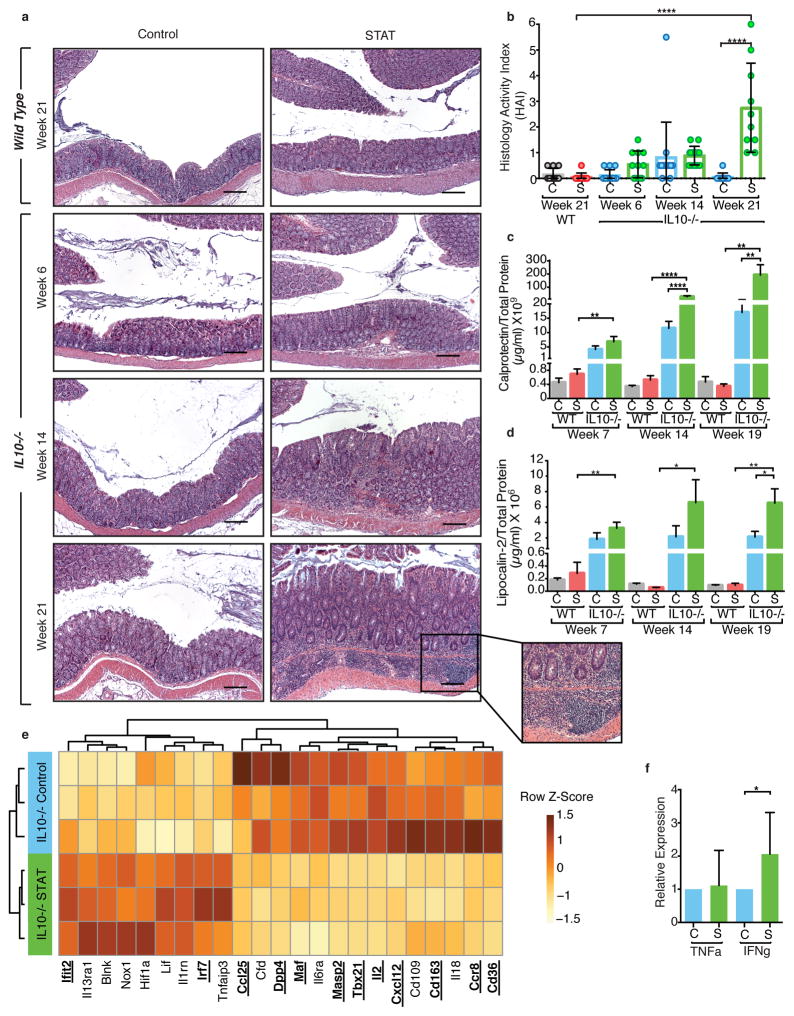
Figure 3. STAT microbiota in IL10−/− mouse increases colonic inflammation.
(a) Representative H&E-stained colon sections from WT (top panels, week 21) and IL10−/− mice (bottom 3 rows of panels, weeks 6, 14, and 21) colonized with Control microbiota (left) or STAT microbiota (right). Inset showing inflammation in IL10−/− STAT mice at week 21 at higher magnification on bottom right. Images are representative from a single experiment. Scale bar = 200 μm. (b) Mean histology activity index (HAI) +/− SD for WT and IL10−/− mice colonized with Control or STAT microbiota. ****p<0.0001, Kruskall-Wallis with Dunn’s post-test. (a–b) WT: n = 10 per group; IL10−/−: Control n = 13, 14, 10 and STAT n = 11, 13, 10 at weeks 6, 14, and 21 respectively. (c–d) ELISA results of calprotectin and lipocalin-2 normalized to total protein levels from fecal supernatants. WT: n = 9 per group; IL10−/−: Control n = 10, 11, 10 and STAT n = 9, 10, 9 at weeks 7, 14, and 19 respectively. Mean +/− SEM, * p<0.05, **p<0.01, ***p<0.001, ****p<0.0001 one way ANOVA with Sidak’s multiple comparison test. (e) Expression of colonic genes that were significantly altered by inoculum in IL10−/− pups (n = 3 each) at 21 weeks, measured by the Nanostring nCounter Mouse Immunology panel. Genes shown in bold and underlined have FDR-adjusted p value < 0.05, by t-test. Genes shown with normal font have FDR-adjusted p value between 0.05 and 0.10. (f) Relative expression of TNF-α and IFN-γ in colonic tissue from week 21 IL10−/− pups, measured by RT-qPCR (STAT TNF-α: n=12; all other groups: n=8), mean +/− SEM *p<0.05 t-test. (a–f) See Supplementary Tables 5–6 for detailed statistics.

