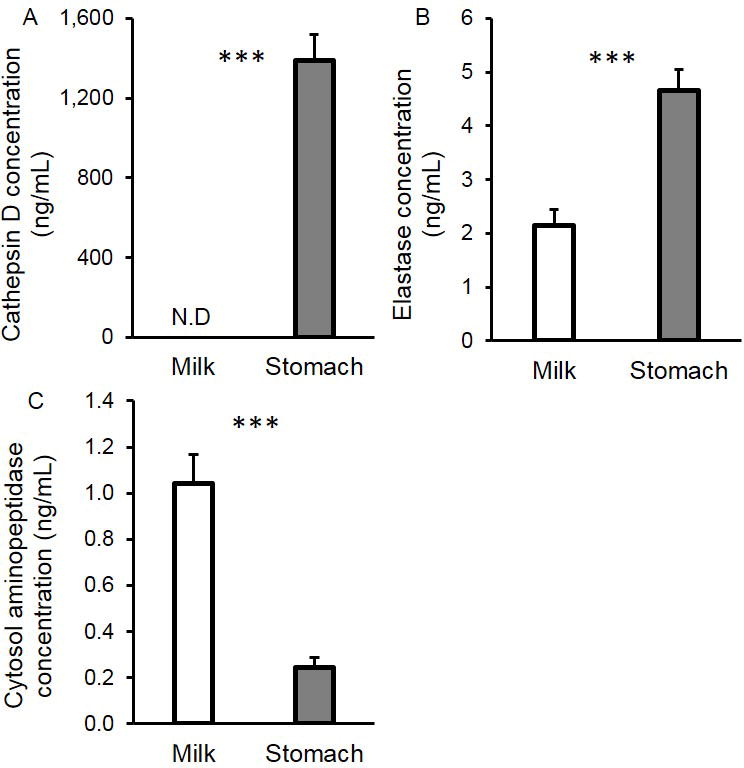
FIGURE 3.

Concentrations of active (A) cathepsin D, (B) elastase and (C) cytosol aminopeptidase in mother’s milk and in the preterm infant stomach (24–32 wk GA, 2–47 days of postnatal age). Values are mean ± SEM. Asterisks represent the p-value (*** = P < 0.001) for N = 18 using the paired t-tests between milk (white bar) and gastric (grey bar) samples.
