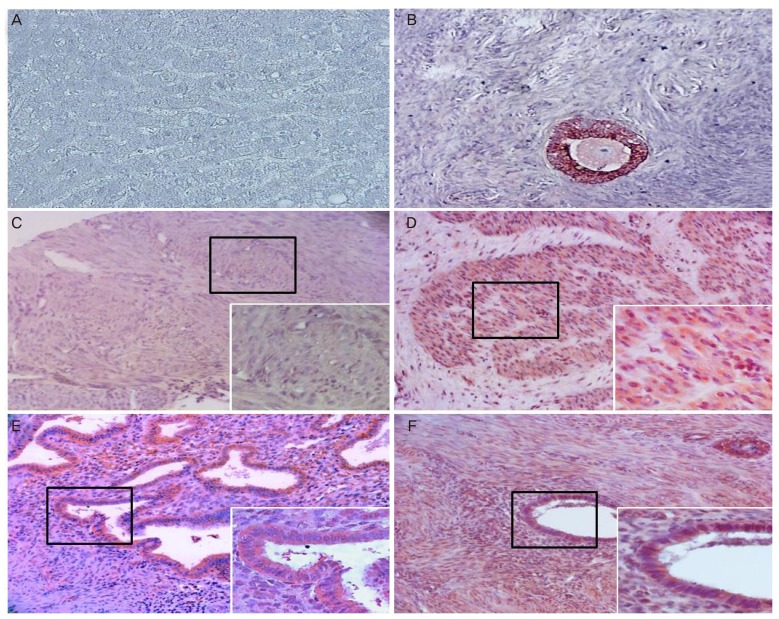
Fig. 2.
Light photomicrographs of human (A) liver (negative control), (B) granulosa cells of preantral follicle in the ovary (positive control), (C) myometrium, (D) myoma, (E) endometrium, and (F) adenomyosis. Each image shows the expression of Müllerian inhibiting substance/anti-Müllerian hormone type II receptor (MIS/AMHRII) in the cell membrane. Right lower boxed area is of higher magnification (×400). Chromogen, amino ethyl carbazol. Magnification (×200).

