Figure 5.

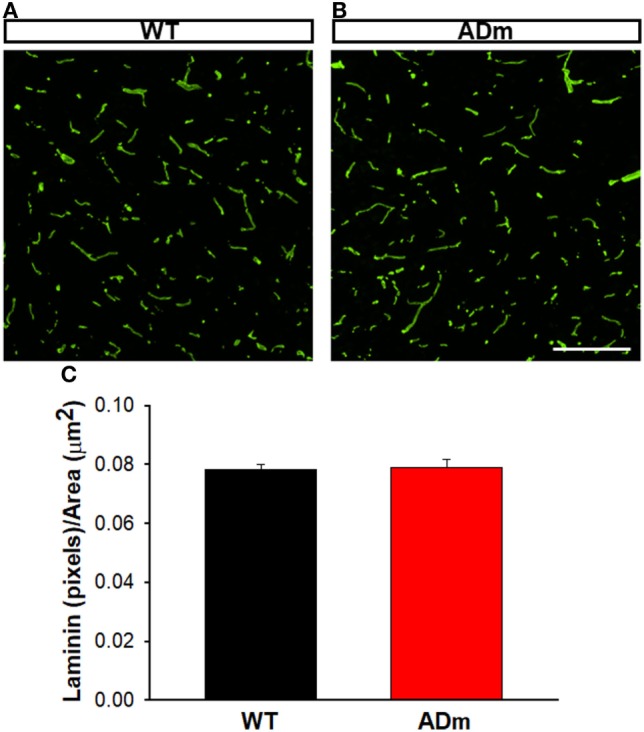
Cortical laminin staining. Cortical cryosections from WT mice (A) and ADm mice (B) subjected to RA exposures were stained with anti-laminin antibody. Scale bar 200 µm. (C) Quantification of the green pixels (laminin) per area (μm2) in WT tissue (black bar) and in ADm tissue (red bar) using Image J software. Using t-test analysis no statistical differences between the two groups, WT vs. ADm, were found. Data are presented as mean ± SE. WT, wild type; ADm, Alzheimer’s disease transgenic mouse; RA, room air.
