Figure 1.
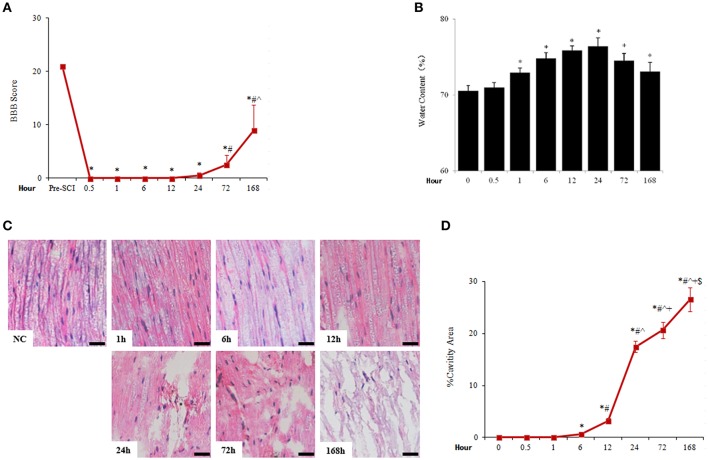
Acute SCI caused rapid and sustained increase of spinal cord water content and tissue damage. (A) The change of BBB score after SCI. N = 7. *p < 0.05 compared to pre-SCI, #p < 0.05 compared to 0.5, 1, 6, 12, and 24 h, ˆp < 0.05 compared to 72 h. (B) Spinal cord water content was assessed by the percentage of the difference of wet weight and dry weight. N = 7. *p < 0.05 compared to control (0 h). (C) Pathological changes of spinal cord adjacent to injury sites were examined by HE staining. Apparent cavities were seen 6 h after spinal cord injuries (scale bar 50 μm). NC, sham. (D) Quantitative analysis of cavity spaces. N = 7. *p < 0.05 compared to control (0 h), #p < 0.05 compared to 6 h, ˆp < 0.05 compared to 12 h, +p < 0.05 compared to 24 h, $p < 0.05 compared to 72 h.

