Figure 3.
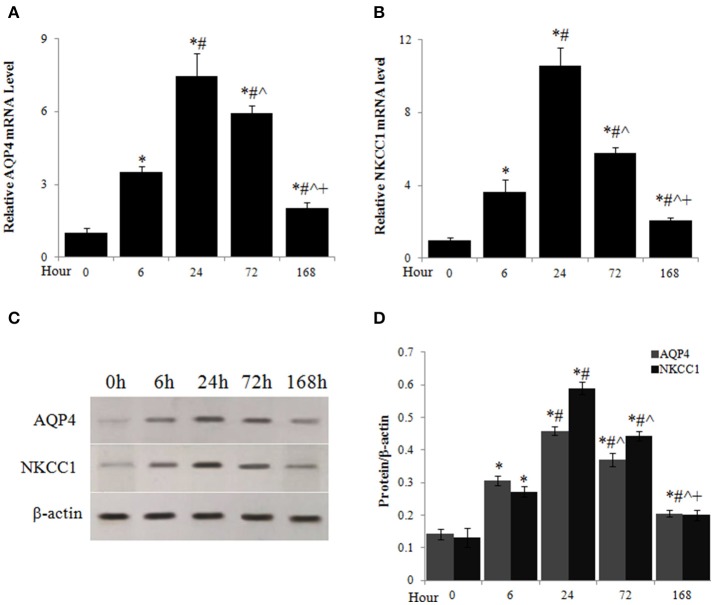
Acute SCI caused upregulation of AQP4 and NKCC1 expression. The mRNA levels of AQP4 (A) and NKCC1 (B) at different time points after SCI were analyzed by quantitative PCR. (C) AQP4 and NKCC1 protein levels at different time points after SCI were assessed by western blot. (D) Quantitative analysis of the changes of AQP4 and NKCC1 protein in spinal cord after SCI. N = 7. *p < 0.05 compared to control (0 h), #p < 0.05 compared to 6 h, ˆp < 0.05 compared to 24 h, +p < 0.05 compared to 72 h.

