Figure 1.

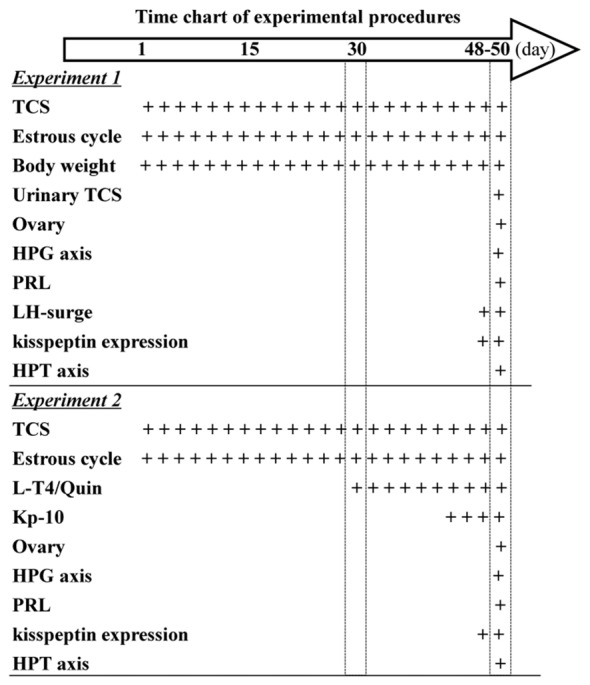
Time chart of experimental procedure. Hollow arrow indicates experimental time (day). “+” indicates the time of drugs administration and examination.

Time chart of experimental procedure. Hollow arrow indicates experimental time (day). “+” indicates the time of drugs administration and examination.