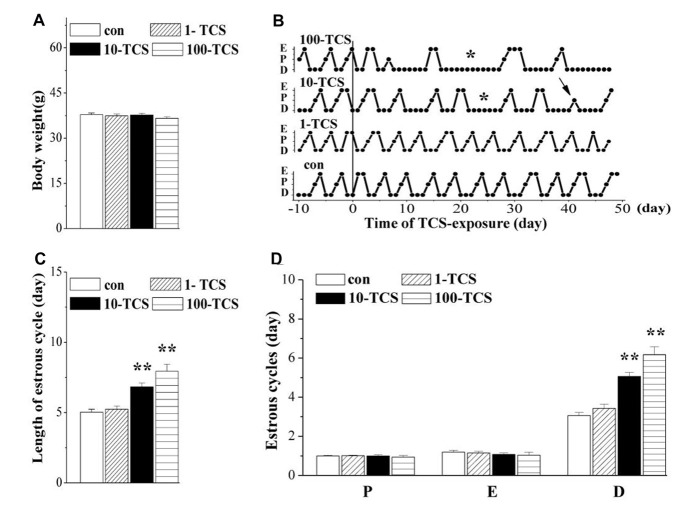
Figure 2.
Triclosan (TCS) causes prolongation of diestrus. (A) Body weights (g) of mice. (B) Representative estrous cycles before and after TCS-exposure for 50 days. Connected dots indicate the time of diestrus (D), proestrus (P) or estrus (E), respectively. *: persistent diestrus; ↑: loss of proestrus. (C) Bar graph shows the mean time (day) of one estrous cycle within TCS-exposure. **P < 0.01 vs. control mice (one-way ANOVA). (D) Bars represent the mean length (day) of diestrus (D), proestrus (P), or estrus (E), respectively, per estrous cycle. **P < 0.01 vs. control mice (one-way ANOVA).

