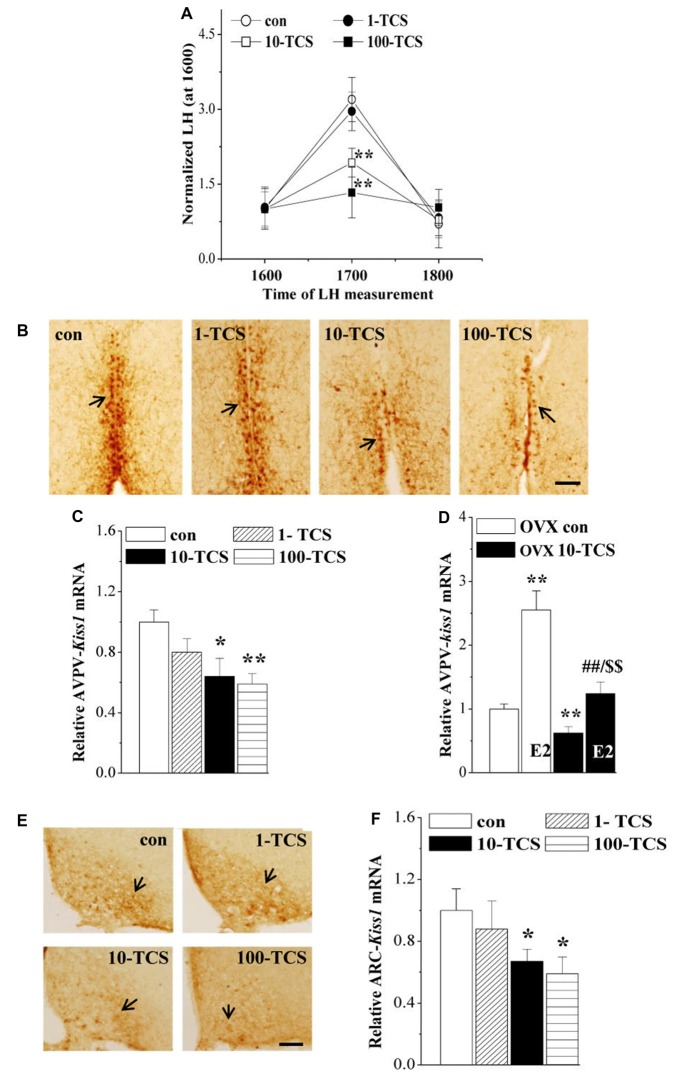
Figure 4.
TCS suppresses luteinizing hormone (LH)-surge and kisspeptin expression. (A) Each point represents mean levels of LH that are normalized by the LH level at 1600. **P < 0.01 vs. control mice (one-way ANOVA). (B) Representative picture of kisspeptin immune-staining in anteroventral periventricularnucleus (AVPV) of proestrus control mice and TCS mice. Black arrows indicate AVPV-kisspeptin+ cells. Scale bars = 100 μm. (C,D) Bar graphs indicate the levels of AVPV-kiss1 mRNA in proestrus mice or E2-treated OVX mice. *P < 0.05 and **P < 0.01 vs. control mice; ##P < 0.01 vs. OVX 10-TCS mice; $$P < 0.01 vs. E2-treated ovariectomized (OVX) control mice (two-way ANOVA). (E) Representative picture of kisspeptin immune-staining in arcuate nucleus (ARC) of diestrus control mice and TCS mice. Scale bars = 100 μm. (F) Bars indicate the levels of ARC-kiss1 mRNA in diestrus control mice and TCS mice. *P < 0.05 vs. control mice (one-way ANOVA).

