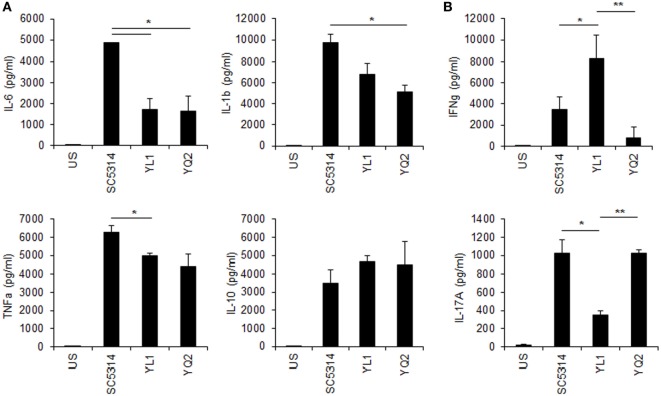
Figure 6.
Peripheral blood mononucleated cells (PBMCs)’ cytokine response to YL1 and YQ2 infection. PBMC were exposed to Candida YL1 and YQ2 isolates (E:T = 1:10) for 5 days. Then, supernatants were harvested and assessed for innate (A) and adaptive (B) cytokine levels, as detailed above. Data are represented as mean ± SD. *p < 0.05, YL1 vs YQ2; **p < 0.01, YL1 vs YQ2. US indicates unstimulated cells.

